This topic contains a solution. Click here to go to the answer
|
|
|

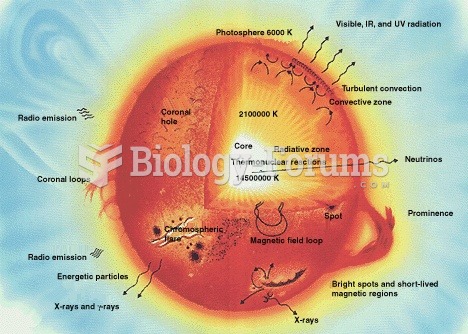 This diagram shows a cross-section of a solar-type star.
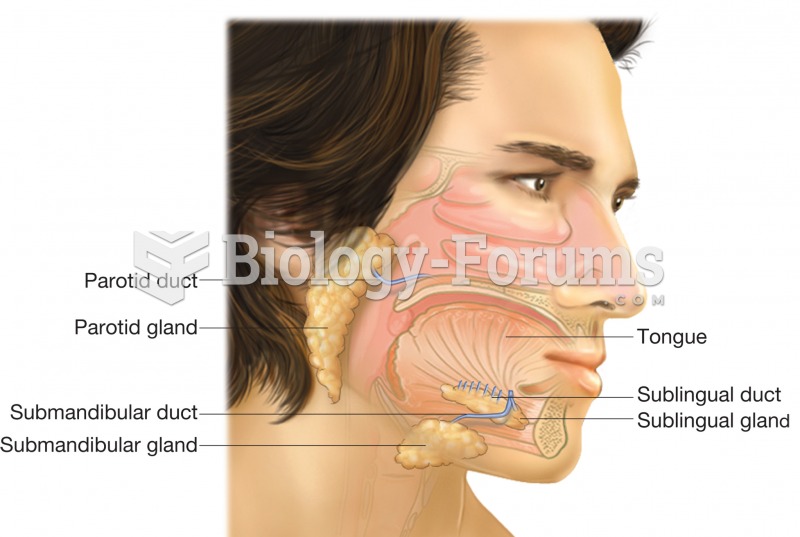 The salivary glands, parotid, sublingual, and submandibular. This image shows the position of each g
 Dose-Response Curves for Morphine
 The population of Asia increases rapidly, the demand for food and water is also growing
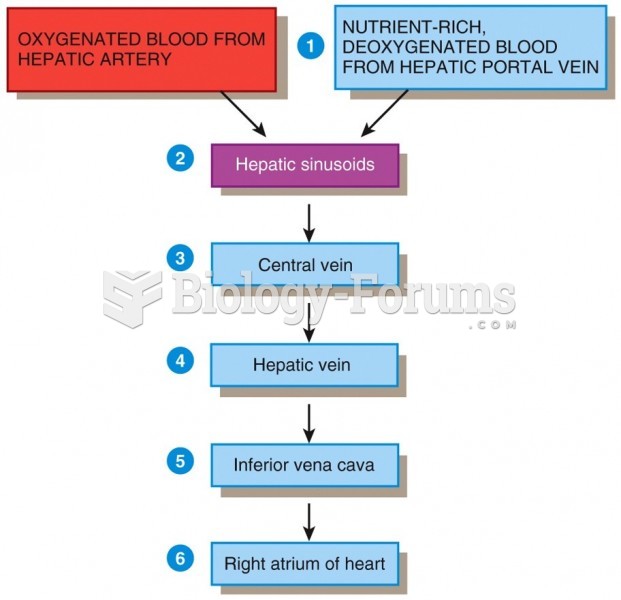 Blood Supply of the Liver
 Milk, nuts, seeds, fish