This topic contains a solution. Click here to go to the answer
|
|
|

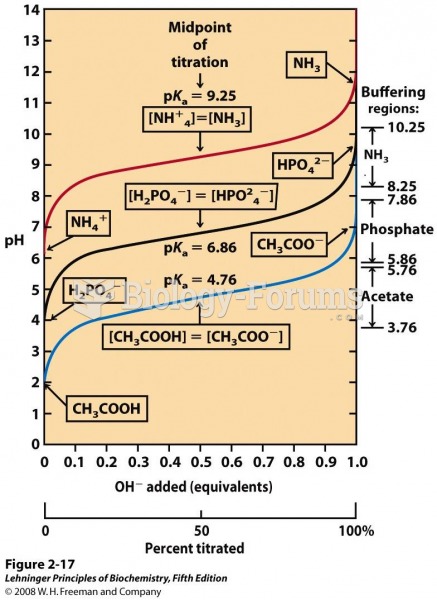 Comparison of the titration curves of three weak acids
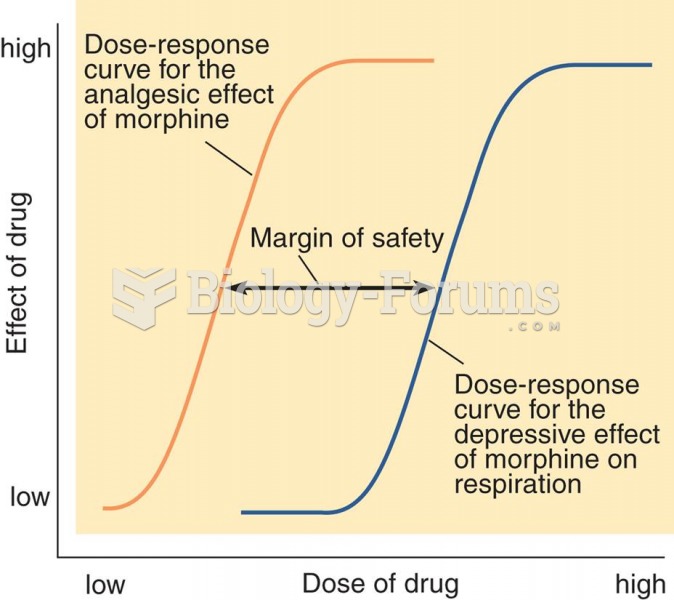 Dose-Response Curves for Morphine
 The posted octane rating in most high-altitude areas shows regular at 85 instead of the usual 87.
 Connect a fused jumper wire to supply 12 volts to terminal 86 and a ground to terminal 85 of the ...
 Thanks to agricultural advances, the world’s farmers can grow plenty of food
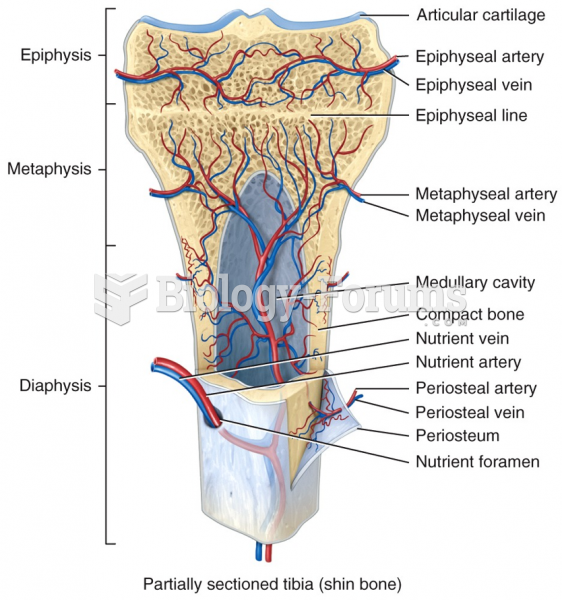 Blood and Nerve Supply of Bone