This topic contains a solution. Click here to go to the answer
|
|
|

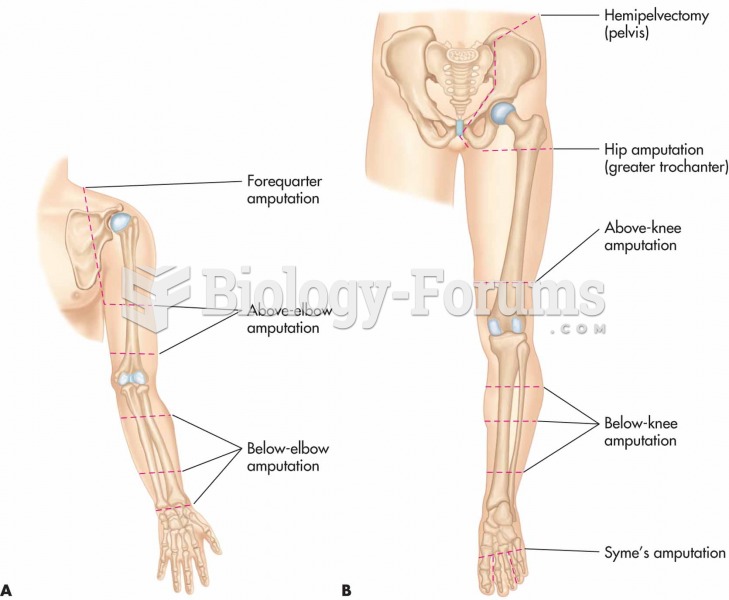 Common sites of amputation. (A) Upper extremities. (B) Lower extremities. The surgeon determines th
 The Rotation Curves of Four Spiral Galaxies
 This January 1937 photo from Sneedville, Tennessee, shows Eunice Johns, age 9, and her husband, ...
 Demonstrate the Application of Triangular, Figure-Eight, and Tubular Bandages
 The demand for oil can be reduced significantly with the introduction of new higher vehicle mileage
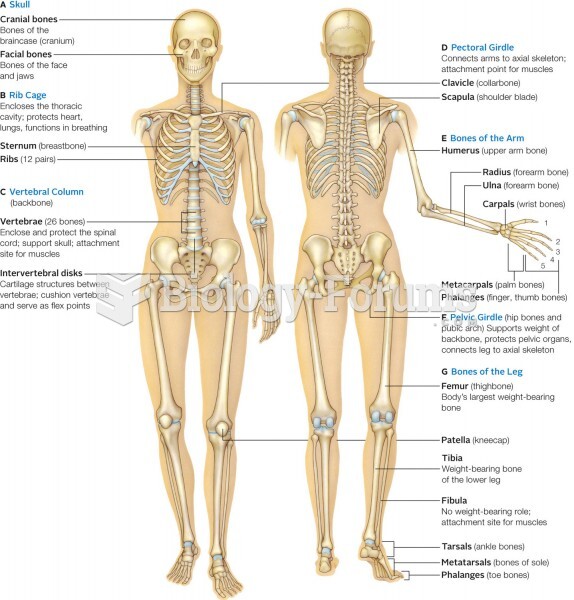 Major bone (tan) and cartilage (light blue) elements of the human skeleton. Inset shows regions of v