This topic contains a solution. Click here to go to the answer
|
|
|

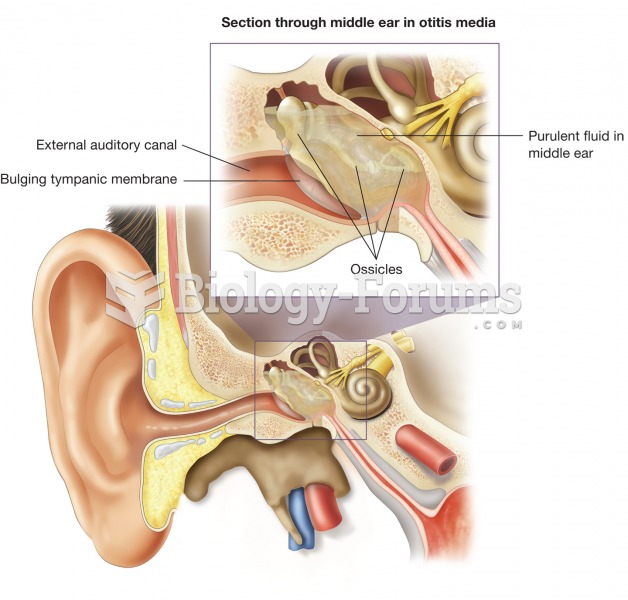 Otitis media. This illustration shows an inflamed tympanic cavity, which is the most common source o
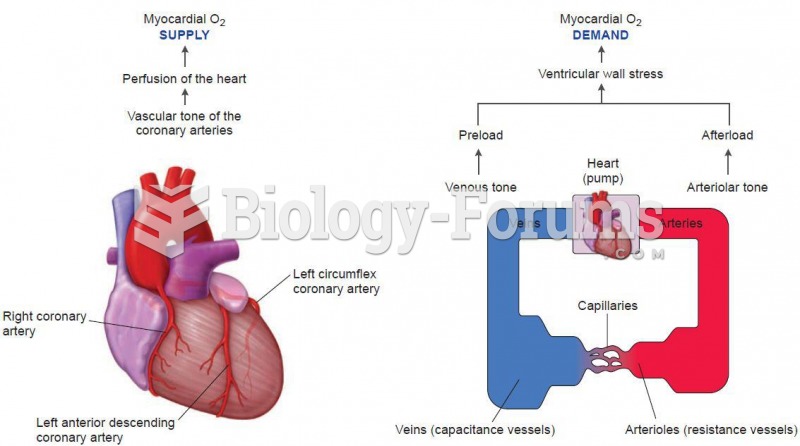 Myocardial Oxygen supply and demand
 In 2013, Americans learned that the federal government massively surveys their phone calls and e-mai
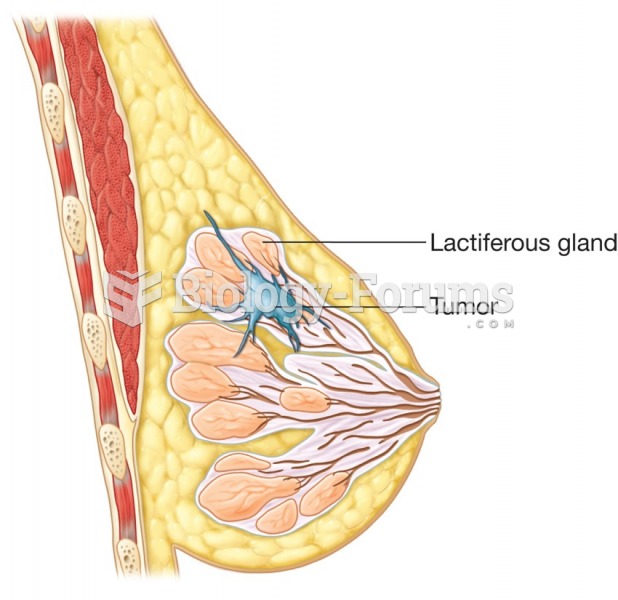 A cancerous tumor growing within the milk gland.
 Colossal Figure of Akhenaten
 Nonfat Milk with added protein