This topic contains a solution. Click here to go to the answer
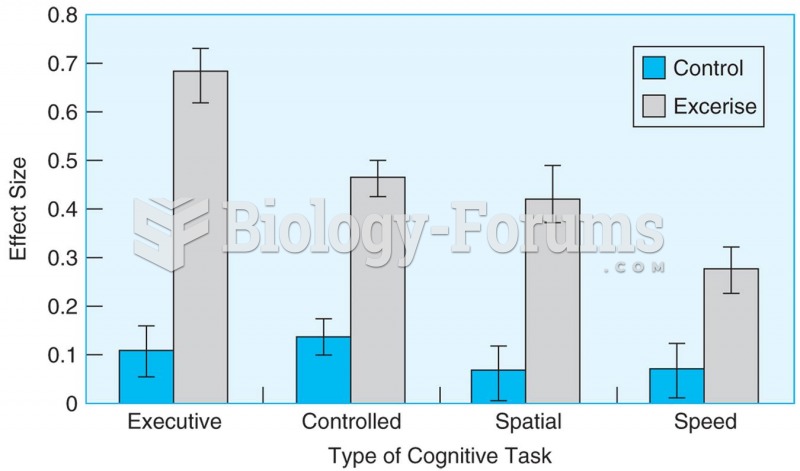
Author Question: The above figure shows supply and demand curves for milk. In an effort to help farmers, the ... (Read 1394 times)

newyorker26

  • Hero Member
  • *****
  • Posts: 536


The above figure shows supply and demand curves for milk. If the government limits milk production to Q2, the loss in social welfare will equal
◦ f + g.
◦ b + f.
◦ c + g.
◦ b + c + f + g.


Related Topics

Need homework help now?

Ask unlimited questions for free

Ask a Question

lunatika

  • Hero Member
  • *****
  • Posts: 548


The above figure shows the demand and supply curves in the market for milk. Currently the market is in equilibrium. If the government imposes a $2 per gallon tax to be collected from sellers, estimate the change in p, Q, and social welfare.


missalyssa26

  • Sr. Member
  • ****
  • Posts: 327
The supply curve shifts vertically by $2. The price changes from $3 per gallon to $4 per gallon. Quantity falls from 1,000 gallons to 500 gallons. The decrease in consumer surplus is (500 + 1000) ∗ 1/2 = $750, and the decrease in producer surplus is (500 + 1000) ∗ 1/2 = $750, and the tax revenue is 2 ∗ 500 = $1000. Therefore the change in social welfare is $1000 - $750 - $750 = $500.


leo leo

  • Hero Member
  • *****
  • Posts: 566


The above figure shows the demand and supply curves in the market for milk. Currently, the market is in equilibrium. If the government imposes a $2 per gallon tax to be collected from sellers, calculate the dead weight loss associated with the tax, and explain why the dead weight loss occurs.


aprice35067

  • Sr. Member
  • ****
  • Posts: 337
The deadweight loss equals .5 ∗ 2 ∗ 500 ∗ $500. The deadweight loss occurs because the tax lowers the output from the competitive level. At the output level that occurs with the tax, consumers value the last unit of output by more than it costs to produce that unit.


vinney12

  • Hero Member
  • *****
  • Posts: 586


The above figure shows the demand and supply curves in the market for milk. Currently the market is in equilibrium. If the government establishes a $4 per gallon price support, estimate the change in p, Q, and social welfare.


Chou

  • Sr. Member
  • ****
  • Posts: 335
Price rises to $4 per gallon. Consumers purchase only 500 gallons of milk. The government purchases 1,000 gallons of milk to support the price at $4. Thus, a total of 1,500 gallons is produced. The loss in social welfare equals 1,000 gallons of milk at $4/gallon (equals $4,000) less the producer surplus above the old demand curve up to a price of $4 (which is $500). The loss in social welfare is $3,500.


Did you know?

Malaria mortality rates are falling. Increased malaria prevention and control measures have greatly improved these rates. Since 2000, malaria mortality rates have fallen globally by 60% among all age groups, and by 65% among children under age 5.

Did you know?

Drug-induced pharmacodynamic effects manifested in older adults include drug-induced renal toxicity, which can be a major factor when these adults are experiencing other kidney problems.

Did you know?

According to the Migraine Research Foundation, migraines are the third most prevalent illness in the world. Women are most affected (18%), followed by children of both sexes (10%), and men (6%).

Did you know?

Congestive heart failure is a serious disorder that carries a reduced life expectancy. Heart failure is usually a chronic illness, and it may worsen with infection or other physical stressors.

Did you know?

Asthma cases in Americans are about 75% higher today than they were in 1980.

For a complete list of videos, visit our video library