This topic contains a solution. Click here to go to the answer
|
|
|

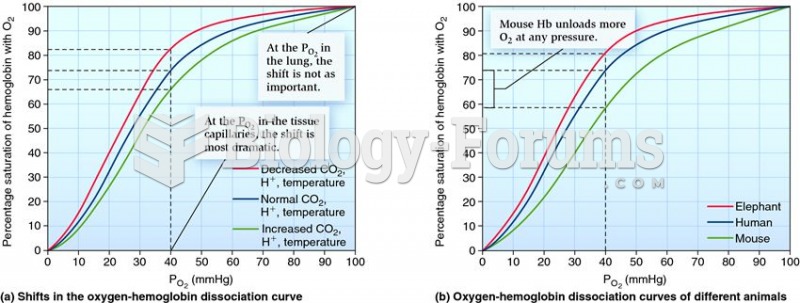 Differences in oxygen-hemoglobin dissociation curves under different physiological conditions and am
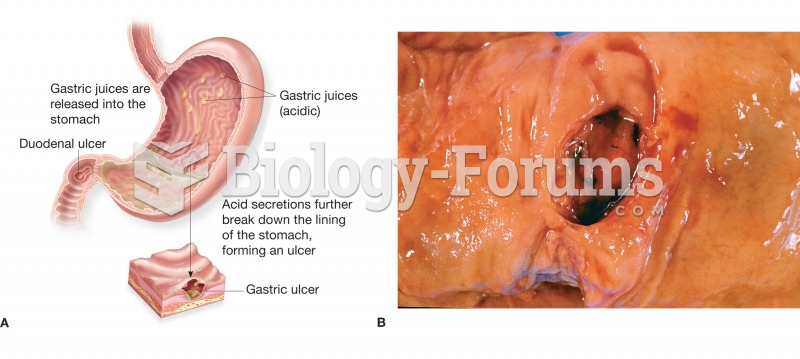 (A) Figure illustrating the location and appearance of a peptic ulcer in both the stomach and the du
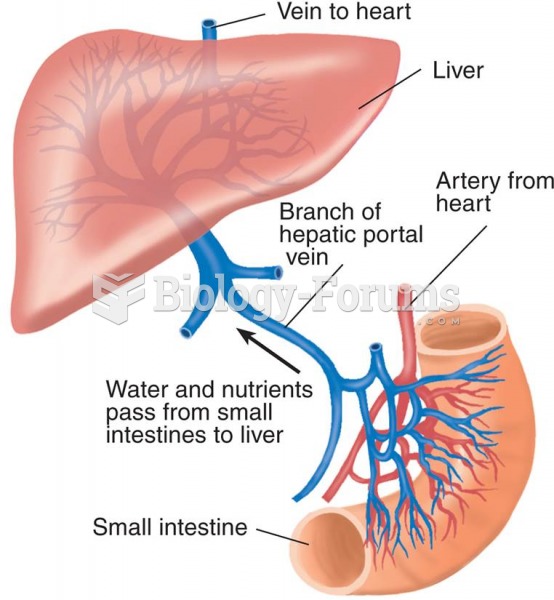 The Hepatic Portal Blood Supply The liver receives water, minerals, and nutrients from the digestive
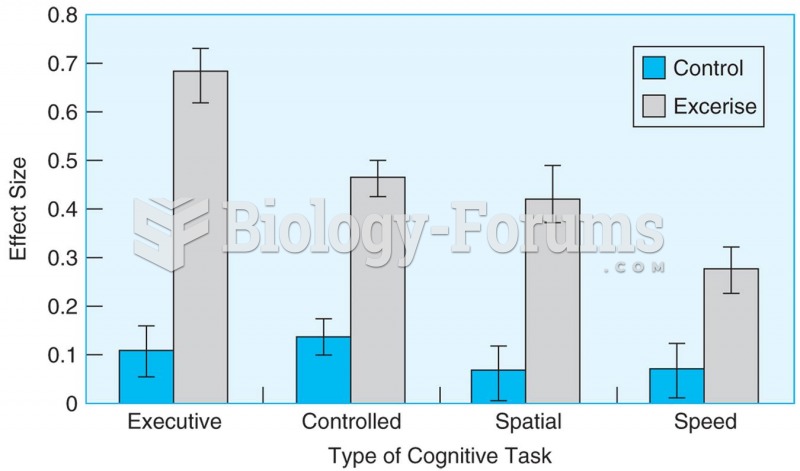 Meta-analysis of 18 studies shows that aerobic exercise causes better performance in older adults on
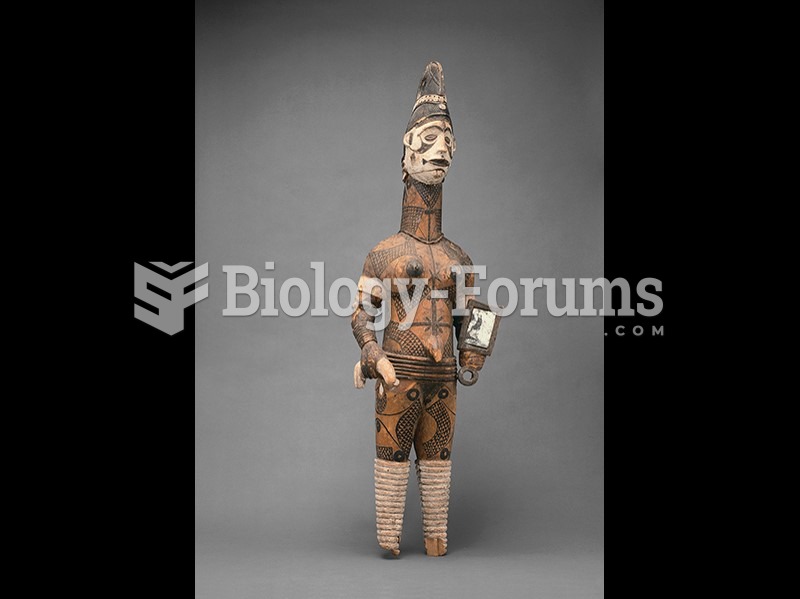 Ugonachomma display figure, Igbo, Nigeria.
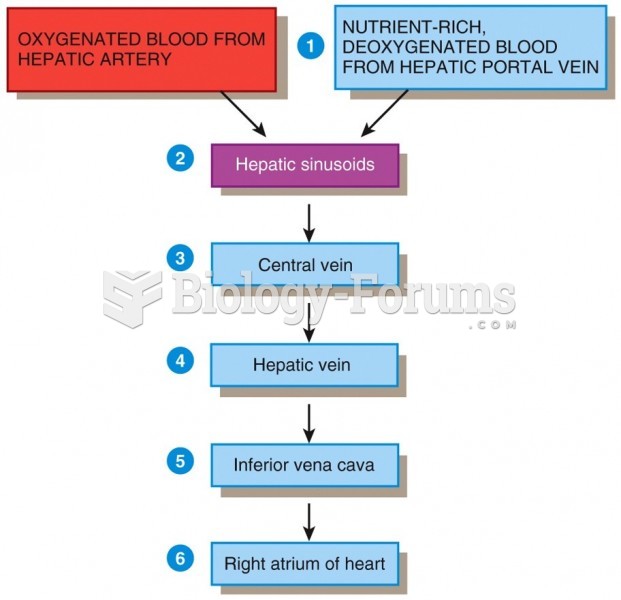 Blood Supply of the Liver