This topic contains a solution. Click here to go to the answer
|
|
|

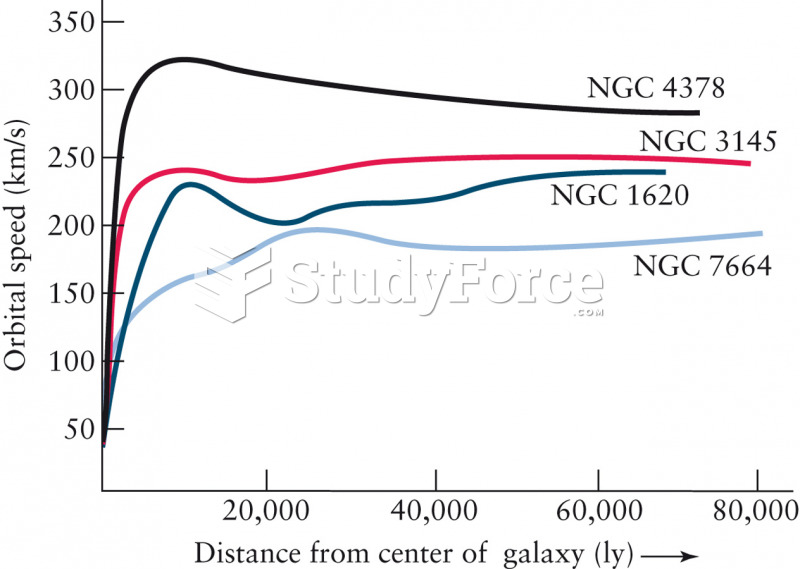 The Rotation Curves of Four Spiral Galaxies
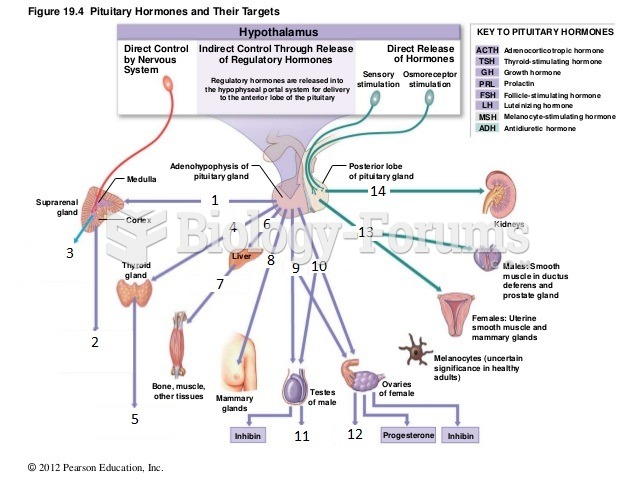 figure 18-1 pituitary hormones
 The end of a typical line wrench, which shows that it is capable of grasping most of the head of ...
 Mobilize each metatarsal–phalangeal joint with figure-8s. Hold the tarsal just below the ...
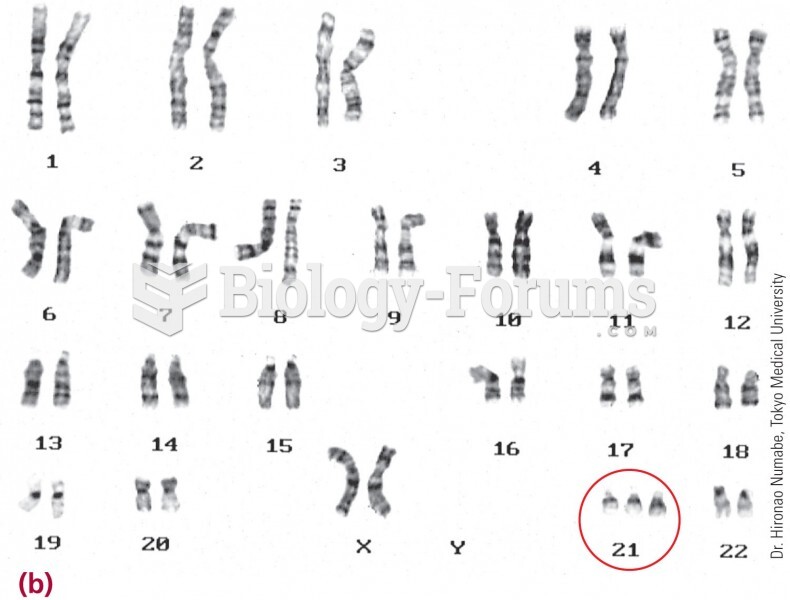 A karyotype shows this child has three copies of chromosome 21.
 Meiosis is used to make sperm and egg cells. A shows a simplified version and B shows a detailed ver