This topic contains a solution. Click here to go to the answer
|
|
|

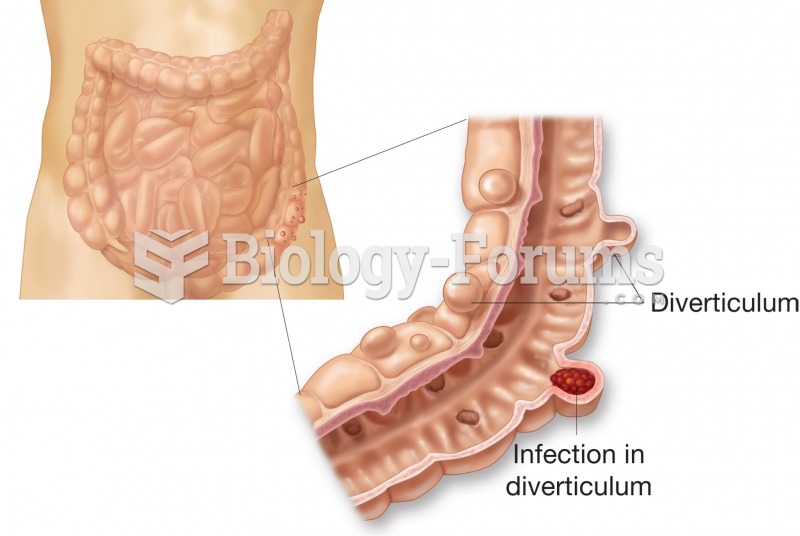 Diverticulosis. Figure illustrates external and internal appearance of diverticula.
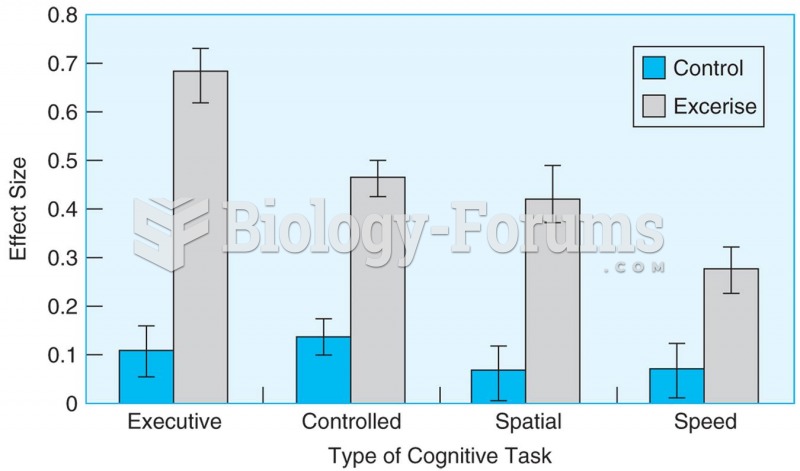 Meta-analysis of 18 studies shows that aerobic exercise causes better performance in older adults on
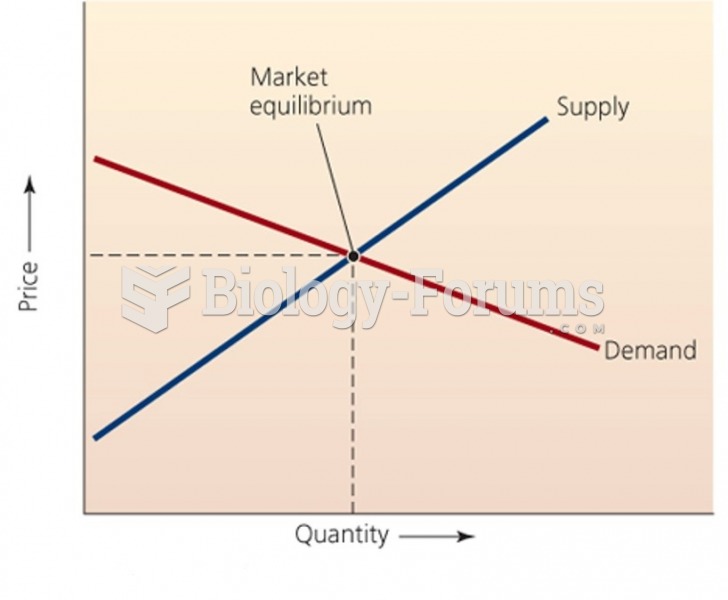 Classic Supply - Demand Curve
 Monitoring shows that many forms of air pollution have decreased
 Figure and Ground
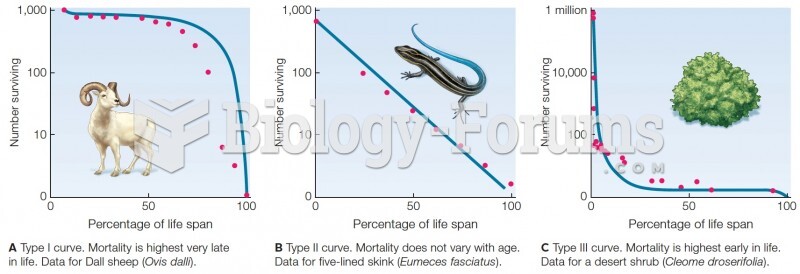 Survivorship curves. Blue lines are theoretical curves. Red dots are data from field studies.