This topic contains a solution. Click here to go to the answer
|
|
|

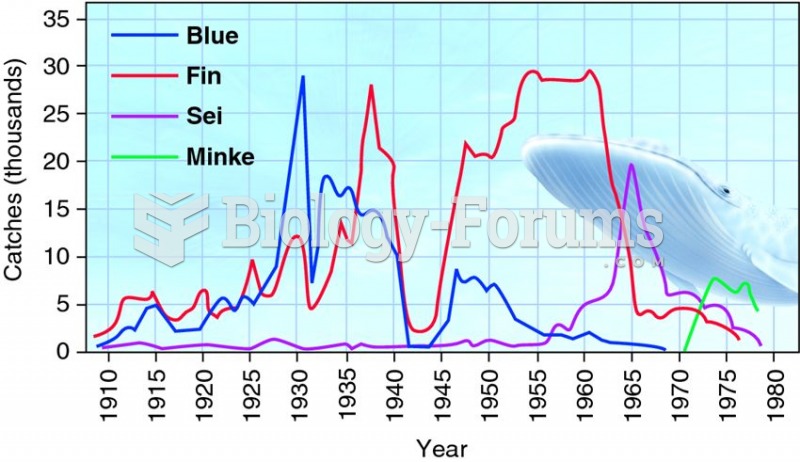 Sequential decline of whale catches in the Antarctic shows the strong effect of human predators.
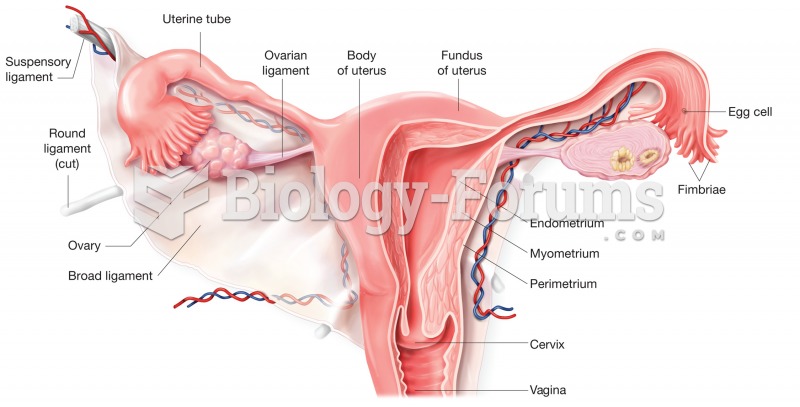 The uterus. Cutaway view shows regions of the uterus and cervix and its relationship to the uterine
 Acute exacerbations of asthma can require management in the emergency department. The child is place
 The photo shows an ultrasound image of a fetus of about 20 weeks’ gestational age.
 Farmers use pesticides on food crops to diminish the damage from pests
 An inventory record sheet shows a balance on hand of 972. During the month units sold were 111, ...