This topic contains a solution. Click here to go to the answer
|
|
|

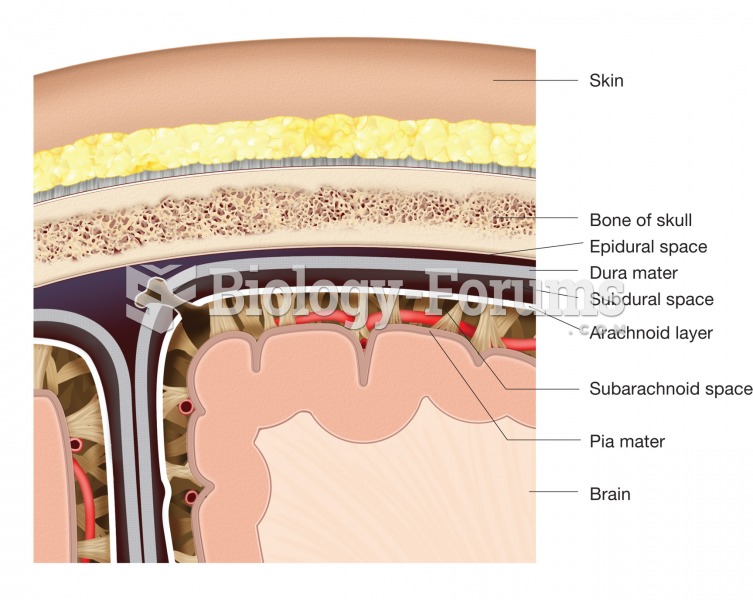 The meninges. This figure illustrates the location and structure of each layer of the meninges and t
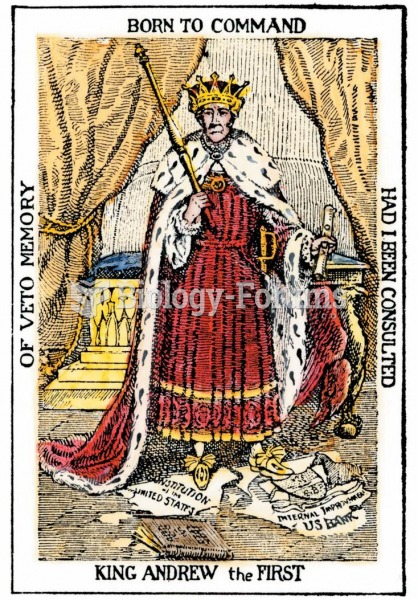 A cartoon of “King Andrew the First” shows Jackson standing atop the U.S. Constitution—a scepter in
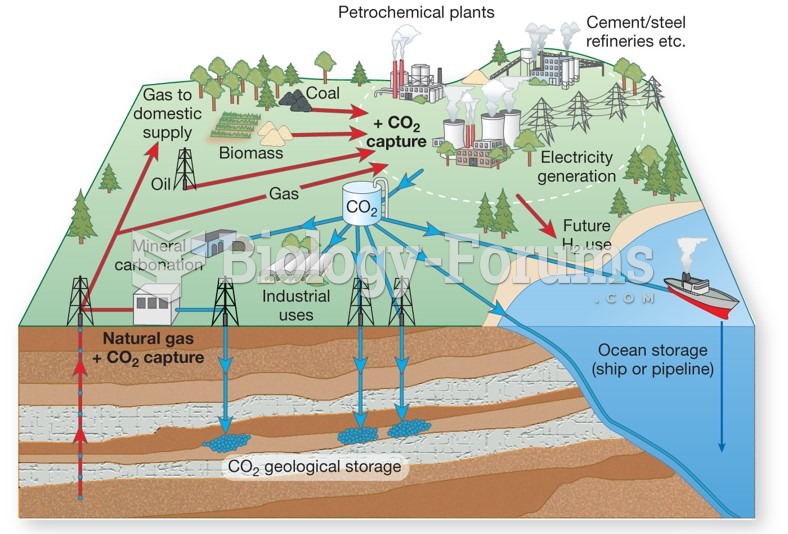 The growing demand for electrical power, carbon sequestration and storage must be a priority
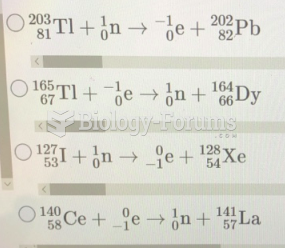 Which of the following reactions correctly shows the transmutation of an element by neutron ...
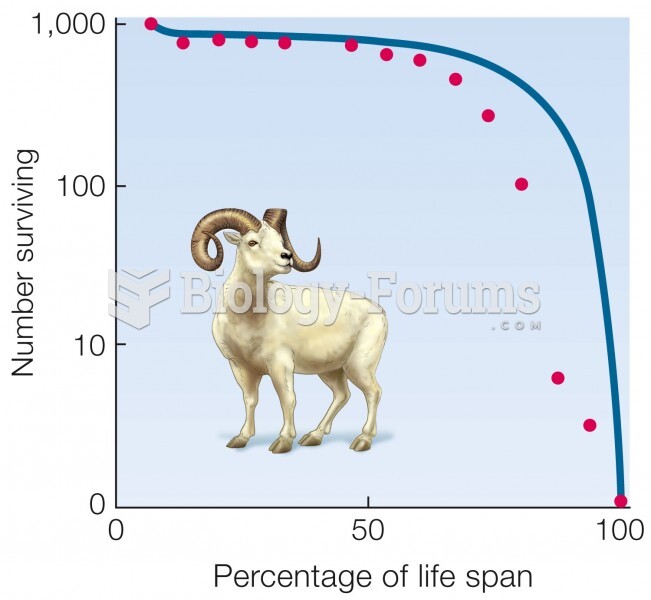 Survivorship curves.
 Sample lod score curves