This topic contains a solution. Click here to go to the answer
|
|
|

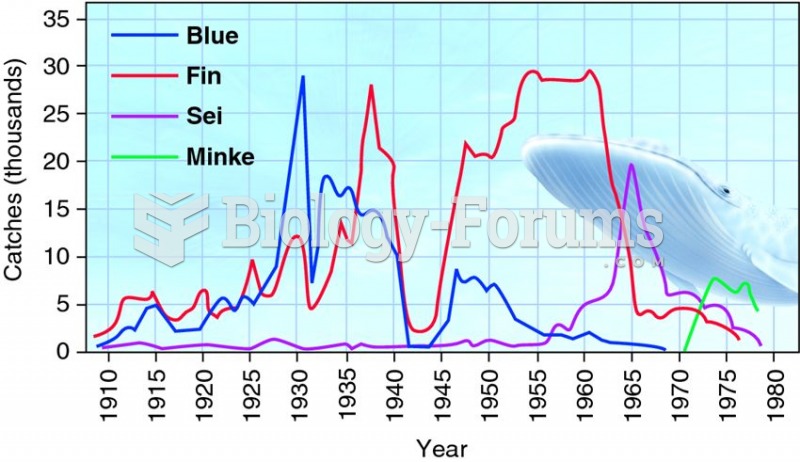 Sequential decline of whale catches in the Antarctic shows the strong effect of human predators.
 This image shows growing blood vessels in the retina of a mouse
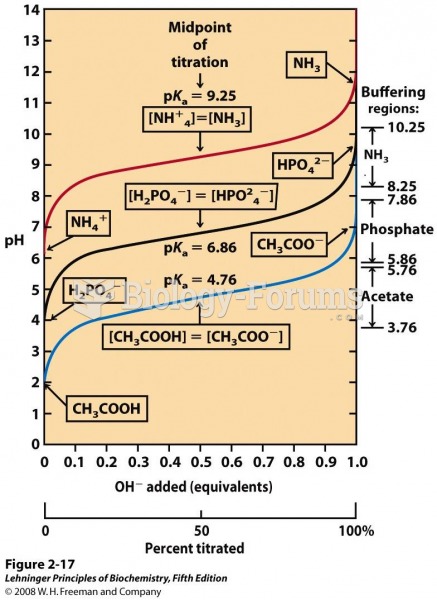 Comparison of the titration curves of three weak acids
 An Oil-dependent World— Supply and Demand Driven
 Which one is more healthier? DARK, MILK or WHITE chocolate
 Farmers use pesticides on food crops to diminish the damage from pests