This topic contains a solution. Click here to go to the answer
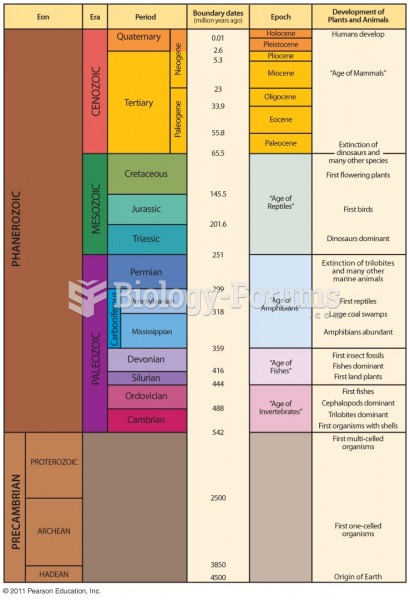
Author Question: A graph is a means of representing client data over time so as to observe the changes (positive or ... (Read 70 times)

leo leo

  • Hero Member
  • *****
  • Posts: 566
A graph is a means of representing client data over time so as to
  observe the changes (positive or negative or none at all) and to
  respond to these changes with appropriate professional helping.
 
  A. True.
  B. False.

Question 2

What type of reliability is most often used in single-system design
  evaluations?
 
  A. Inter-observer reliability.
  B. Test-retest reliability.
  C. Alternative form reliability.
  D. Client reliability.


Related Topics

Need homework help now?

Ask unlimited questions for free

Ask a Question
Marked as best answer by a Subject Expert

jxjsniuniu

  • Sr. Member
  • ****
  • Posts: 343
Answer to Question 1

A

Answer to Question 2

A


leo leo

  • Member
  • Posts: 566
Reply 2 on: Jun 22, 2018
Wow, this really help


emsimon14

  • Member
  • Posts: 344
Reply 3 on: Yesterday
:D TYSM


Did you know?

Hip fractures are the most serious consequences of osteoporosis. The incidence of hip fractures increases with each decade among patients in their 60s to patients in their 90s for both women and men of all populations. Men and women older than 80 years of age show the highest incidence of hip fractures.

Did you know?

The U.S. Pharmacopeia Medication Errors Reporting Program states that approximately 50% of all medication errors involve insulin.

Did you know?

Illicit drug use costs the United States approximately $181 billion every year.

Did you know?

The effects of organophosphate poisoning are referred to by using the abbreviations “SLUD” or “SLUDGE,” It stands for: salivation, lacrimation, urination, defecation, GI upset, and emesis.

Did you know?

Increased intake of vitamin D has been shown to reduce fractures up to 25% in older people.

For a complete list of videos, visit our video library