|
|
|

 Many hobbies and leisure activities have some risk of health-related injuries
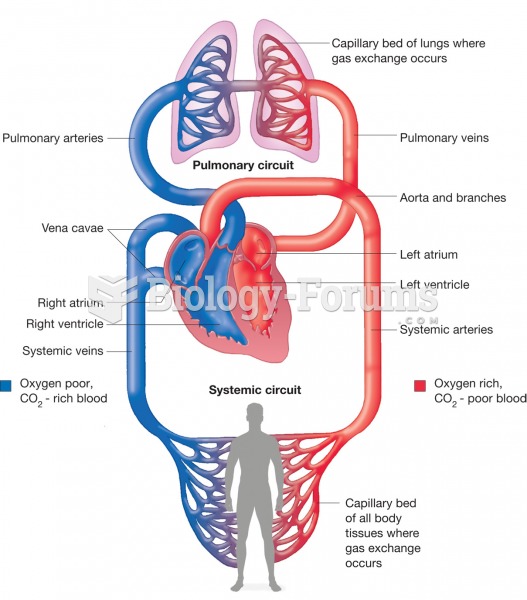 A schematic of the circulatory system illustrating the pulmonary circulation picking up oxygen from
 Page from a copy of Nizami's Khamseh (Quintet) illustrating a princely country feast, Persian, ...
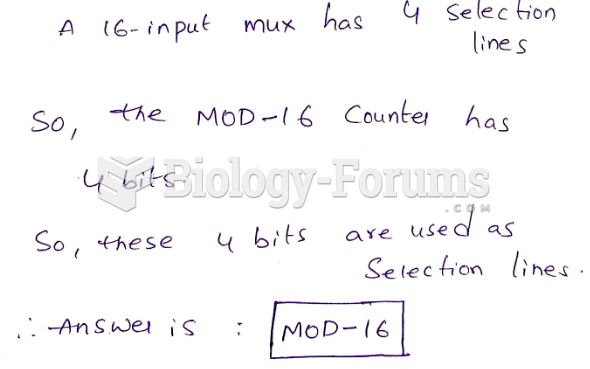 A 16-input multiplexer is to be used to perform parallel-to-serial data conversion. Which of ...
 Phylogenetic tree constructed by comparing homologies in cytochrome c amino acid sequences
 A time map of the genes studied in the experiment