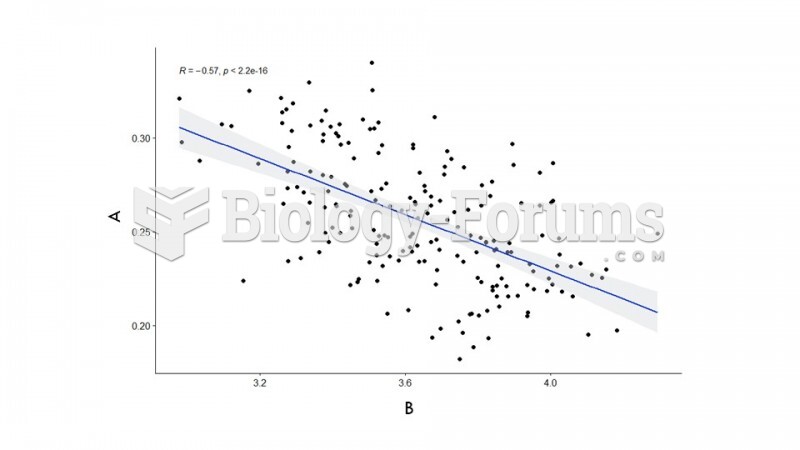
Author Question: What is the difference between a table and a graph, and how is each used? What will be an ideal ... (Read 27 times)

yoooooman

  • Hero Member
  • *****
  • Posts: 557
What is the difference between a table and a graph, and how is each used?
 
  What will be an ideal response?

Question 2

What does Edward Tufte, the famous information designer, recommending when developing graphs and tables that communicate?
 
  What will be an ideal response?


fdliggud

  • Sr. Member
  • ****
  • Posts: 366
Answer to Question 1

Answer: Tables and graphs represent data in different ways. Tables arrange data in columns and rows, allowing you to read down or across to see different relationships. Graphs illustrate the relationship among variables or sets of data as an image or shape drawn in relationship to two axes.
Because they represent data in different ways, tables and graphs have different uses. The table makes it very easy to find exact values. However, the table does not help you see specific patterns and trends. Although the graph does not provide exact values, it highlights trends and relationships by showing the data as a shape. You should choose the form of data graphic that helps your audience most clearly see the important points you want to make about the data.

Answer to Question 2

Answer: Tufte recommends eliminating all distractions that do not help the audience understand the data. For tables, this means eliminating or minimizing all unnecessary gridlines and borders. For graphics, it means removing anything that exists only for decoration. Like graphs, table should be designed so that audience can easily see the data without any distracting content or format.


Related Topics

Need homework help now?

Ask unlimited questions for free

Ask a Question
 

Did you know?

Approximately 15–25% of recognized pregnancies end in miscarriage. However, many miscarriages often occur before a woman even knows she is pregnant.

Did you know?

According to animal studies, the typical American diet is damaging to the liver and may result in allergies, low energy, digestive problems, and a lack of ability to detoxify harmful substances.

Did you know?

Women are 50% to 75% more likely than men to experience an adverse drug reaction.

Did you know?

Multiple experimental evidences have confirmed that at the molecular level, cancer is caused by lesions in cellular DNA.

Did you know?

There used to be a metric calendar, as well as metric clocks. The metric calendar, or "French Republican Calendar" divided the year into 12 months, but each month was divided into three 10-day weeks. Each day had 10 decimal hours. Each hour had 100 decimal minutes. Due to lack of popularity, the metric clocks and calendars were ended in 1795, three years after they had been first marketed.

For a complete list of videos, visit our video library