Answer to Question 1
Answer: Tables and graphs represent data in different ways. Tables arrange data in columns and rows, allowing you to read down or across to see different relationships. Graphs illustrate the relationship among variables or sets of data as an image or shape drawn in relationship to two axes.
Because they represent data in different ways, tables and graphs have different uses. The table makes it very easy to find exact values. However, the table does not help you see specific patterns and trends. Although the graph does not provide exact values, it highlights trends and relationships by showing the data as a shape. You should choose the form of data graphic that helps your audience most clearly see the important points you want to make about the data.
Answer to Question 2
Answer: Tufte recommends eliminating all distractions that do not help the audience understand the data. For tables, this means eliminating or minimizing all unnecessary gridlines and borders. For graphics, it means removing anything that exists only for decoration. Like graphs, table should be designed so that audience can easily see the data without any distracting content or format.

 Checklist for Choosing a Massage Table Cont.
 How to solve an exponential problem using a table of values (Question 2)
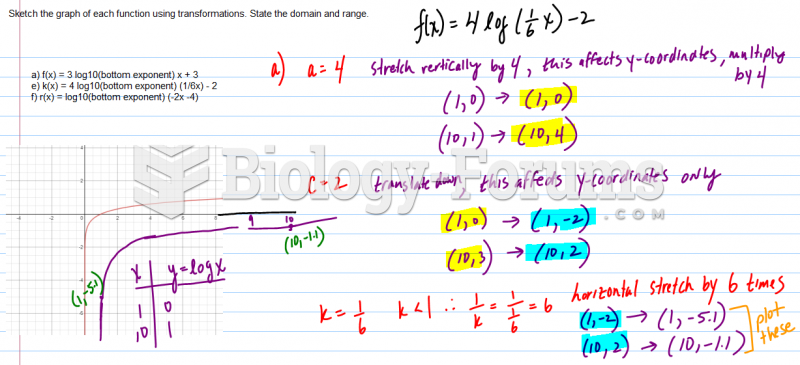 Sketch the graph of each function using transformations. State the domain and range.
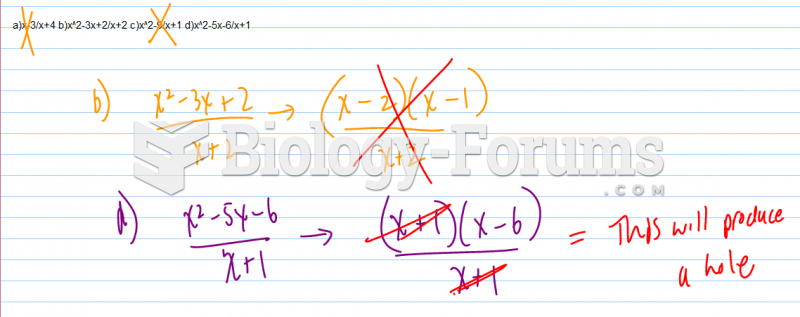 As a result of a hole in the graph, which of the following functions does not have an average ...
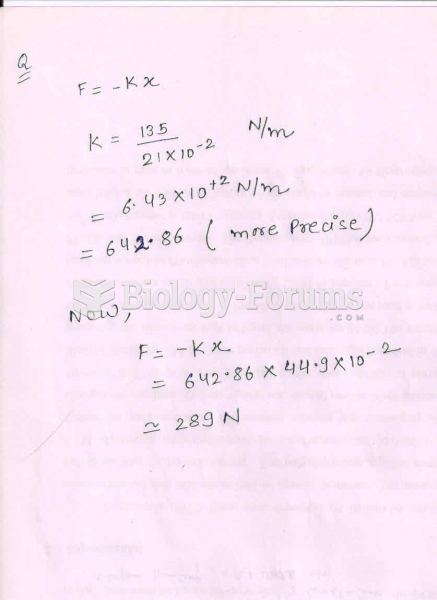 A very light ideal spring stretches by when it is used to hang a 135-N object. What is the ...
 Table salt.