Answer to Question 1
Answer: Tables and graphs represent data in different ways. Tables arrange data in columns and rows, allowing you to read down or across to see different relationships. Graphs illustrate the relationship among variables or sets of data as an image or shape drawn in relationship to two axes.
Because they represent data in different ways, tables and graphs have different uses. The table makes it very easy to find exact values. However, the table does not help you see specific patterns and trends. Although the graph does not provide exact values, it highlights trends and relationships by showing the data as a shape. You should choose the form of data graphic that helps your audience most clearly see the important points you want to make about the data.
Answer to Question 2
Answer: Tufte recommends eliminating all distractions that do not help the audience understand the data. For tables, this means eliminating or minimizing all unnecessary gridlines and borders. For graphics, it means removing anything that exists only for decoration. Like graphs, table should be designed so that audience can easily see the data without any distracting content or format.

 a) Avoid bending your spine from working with the table too low. b) Avoid hiking your shoulders from ...
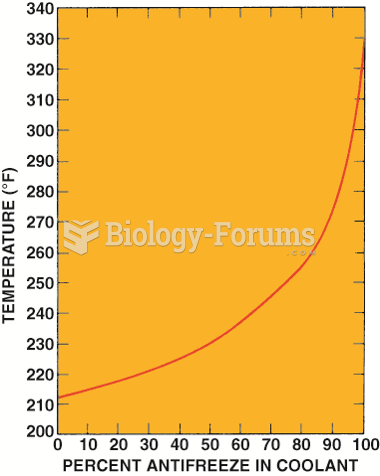 Graph showing how the boiling point of the coolant increases as the percentage of antifreeze in ...
 Good body mechanics when facing the table directly. A. Head and back in alignment. B. Legs and feet ...
 Mobilize the rib cage. Redrape to cover the chest, and stand to one side of the table. Place your ...
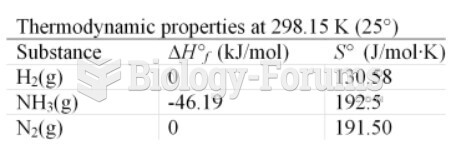 table
table
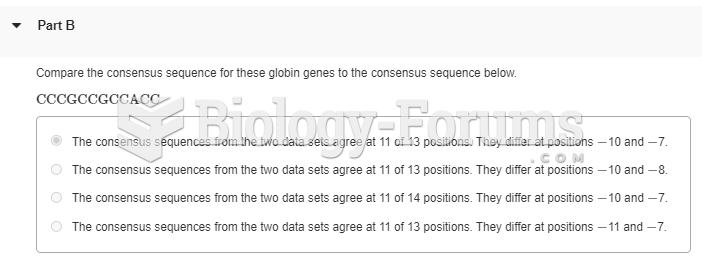 8.The following table contains DNA-sequence information compiled by Marilyn Kozak (1987). The ...