|
|
|

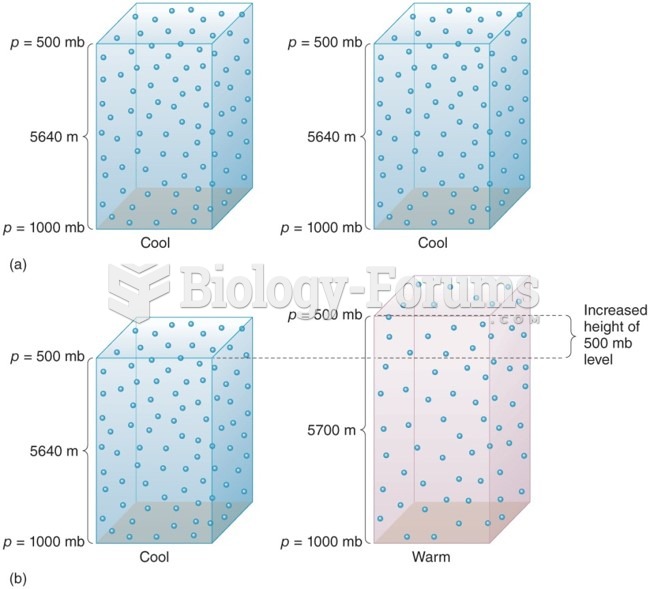 The Distribution of Pressure
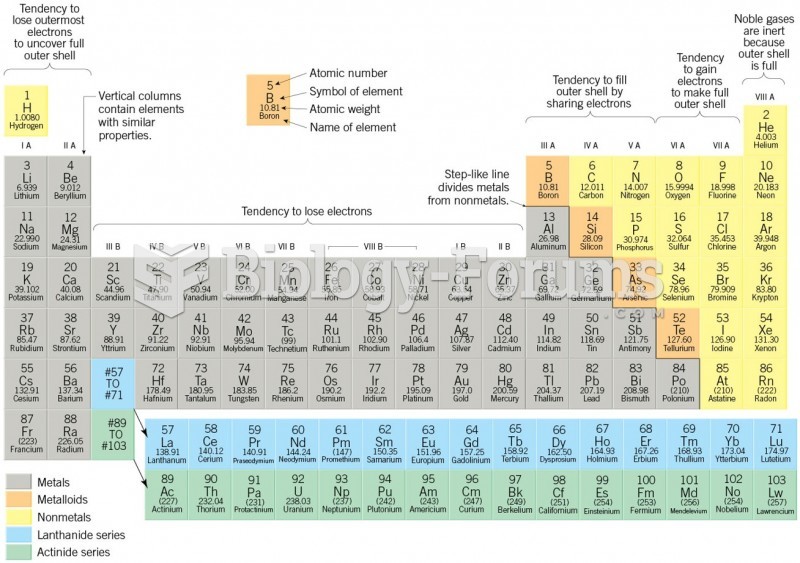 Periodic table of the elements
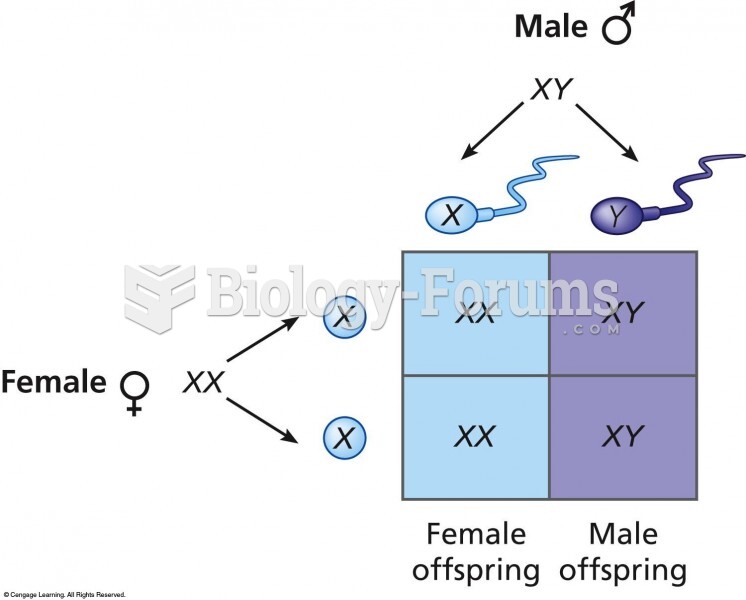 Distribution of sex chromosomes from generation to generation. All children receive an X chromosome
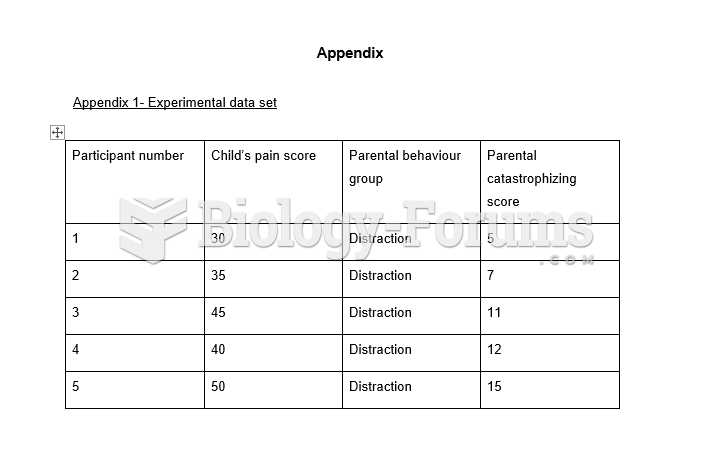 Table - Correlation Analysis
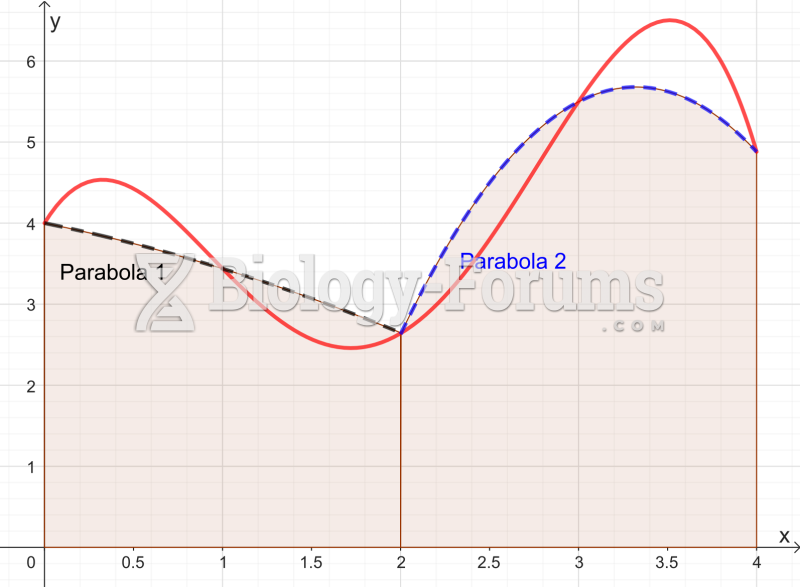 Graph approximated by two parabolas for the Simpson's rule
 The frequency distribution of the allele in Africa, Southern Europe, the Middle East