|
|
|

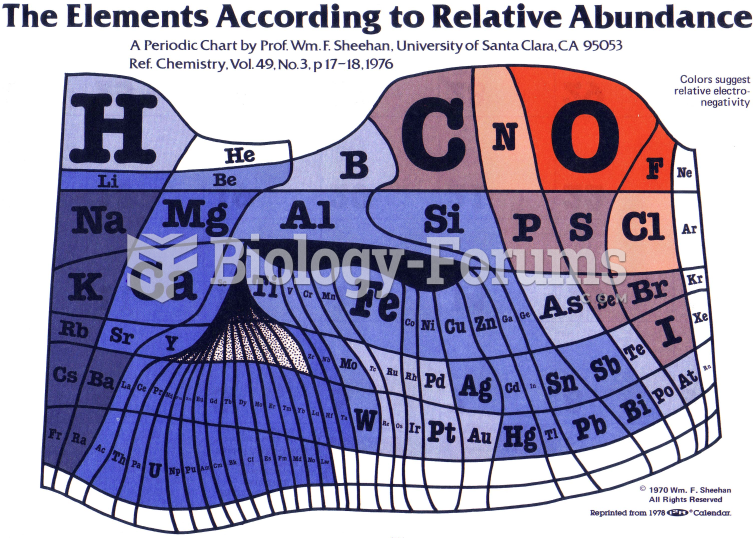 Periodic Table
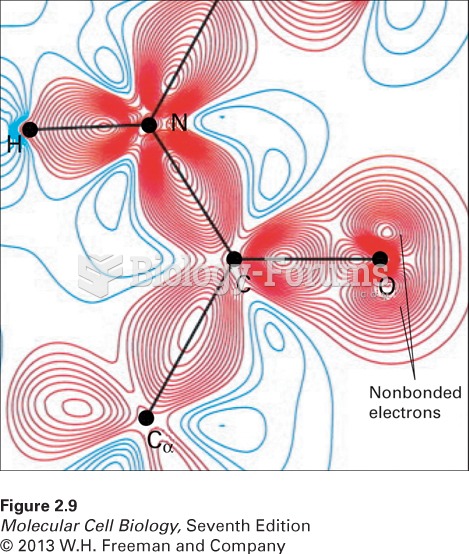 Distribution of bonding and outer nonbonding electrons in the peptide group
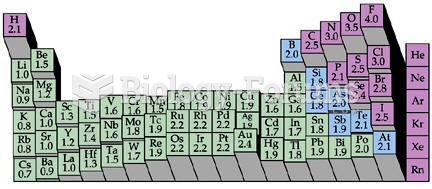 Electronegativity Chart (Periodic Table)
 Finish with bilateral stroking to the entire back. Stand at head of the table with fingers pointing ...
 Handcrafted wooden coffee table
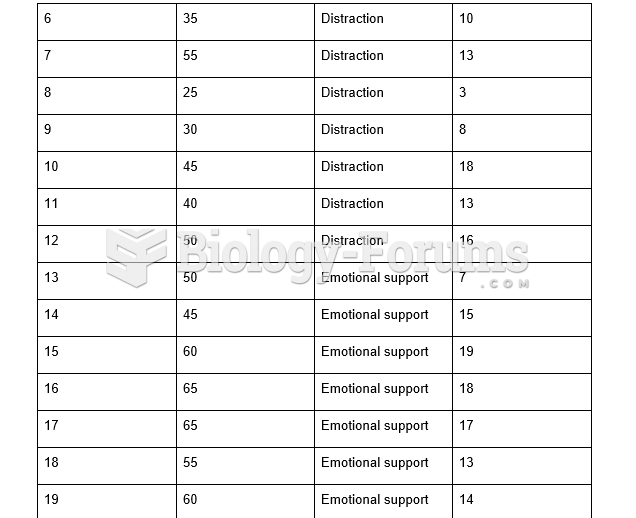 Table - Correlation Analysis