|
|
|

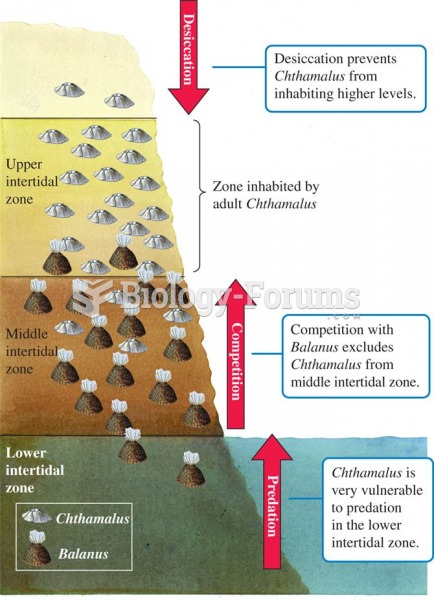 Environmental factors restricting the distribution of Chthamalus to the upper intertidal zone.
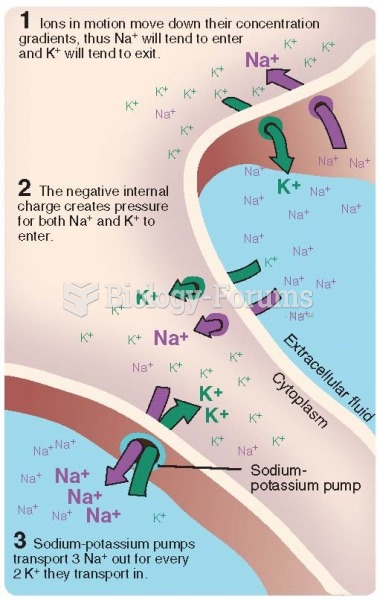 Three factors that influence the distribution of Na+ and K+ ions across the neural membrane.
 How to graph quadratic equations that are in factored form y=a(x−r)(x−s)
 Perform horizontal stroking of the thigh by facing the table and placing hands on the thigh with ...
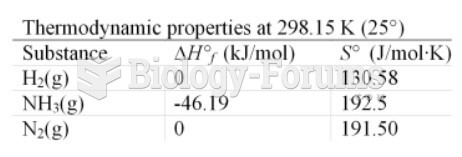 table
table
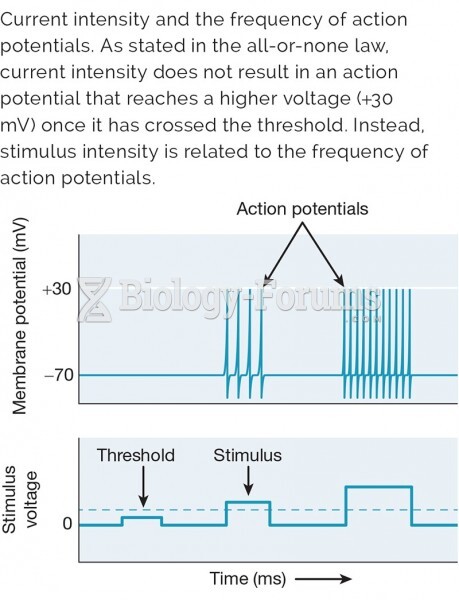 Current intensity and the frequency of action potentials