This topic contains a solution. Click here to go to the answer
|
|
|

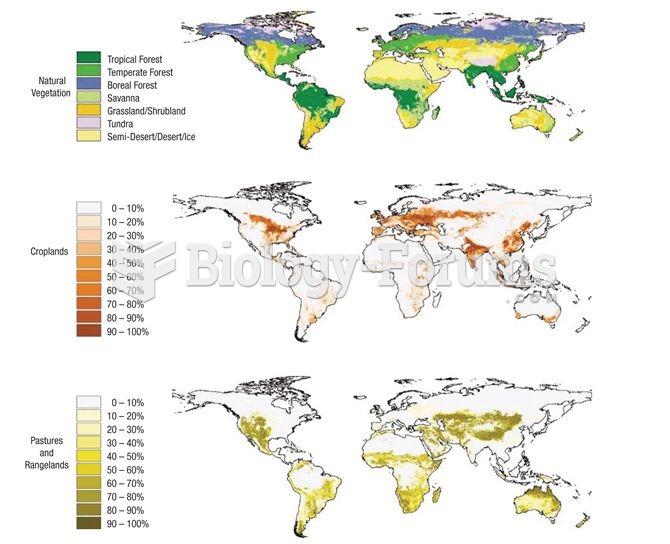 Extent of agricultural activity across the planet (data from Foley et al. 2005).
 "Visual Acuity Testing, Assessing Distance Vision
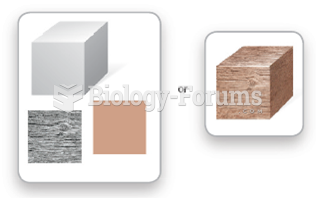 Working Memory Binds Visual Features into a Single Chunk
 Because of immature visual-motor coordination, young children find it hard to throw and catch small ...
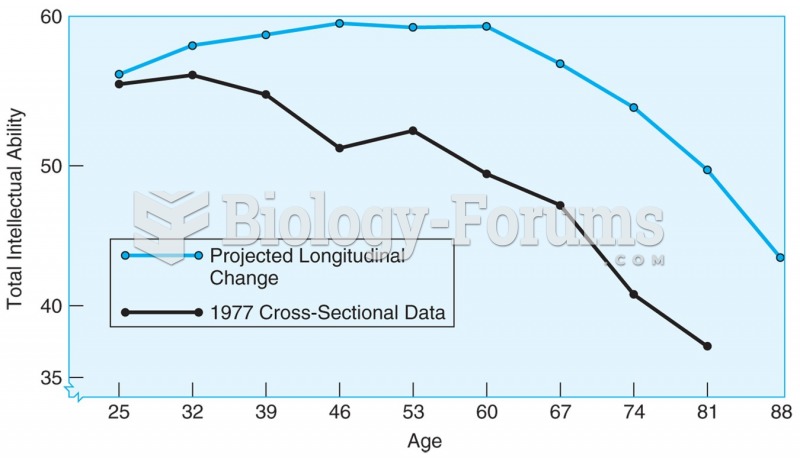 4.1 Age changes in total IQ based on cross-sectional data (lower line) and longitudinal data ...
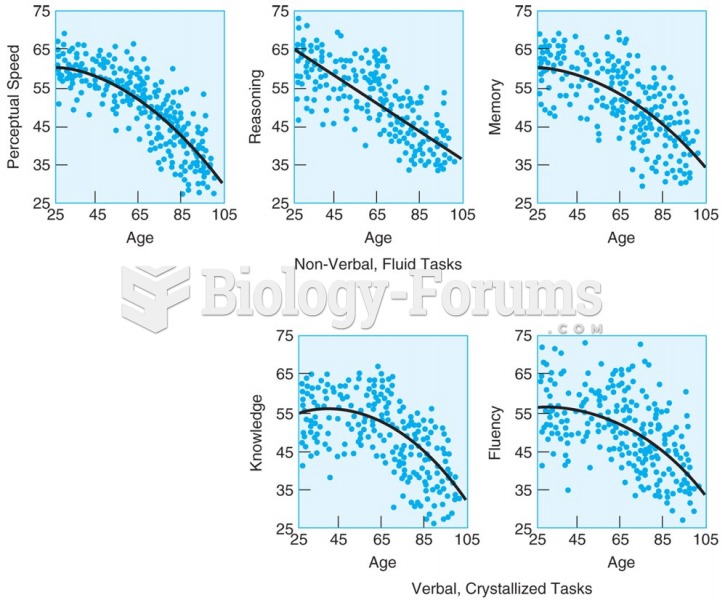 Adults in the Berlin Study of Aging show earlier declines on tests of nonverbal, fluid tasks (upper ...