|
|
|

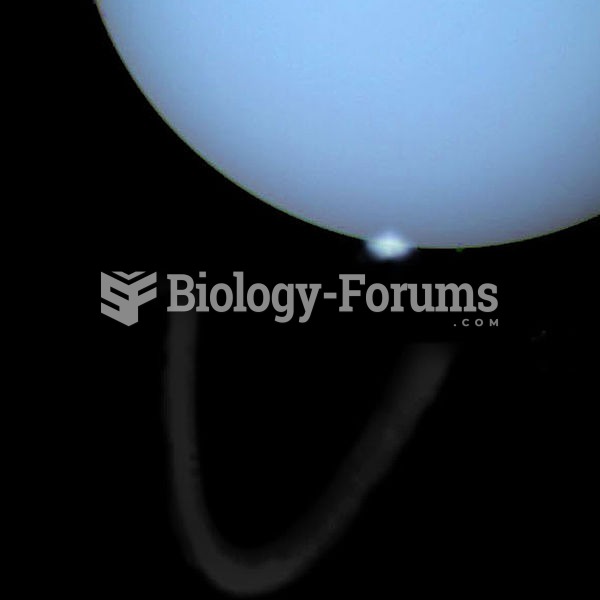 Uranus's aurorae against its equatorial rings, imaged by the Hubble telescope. Unlike the auror
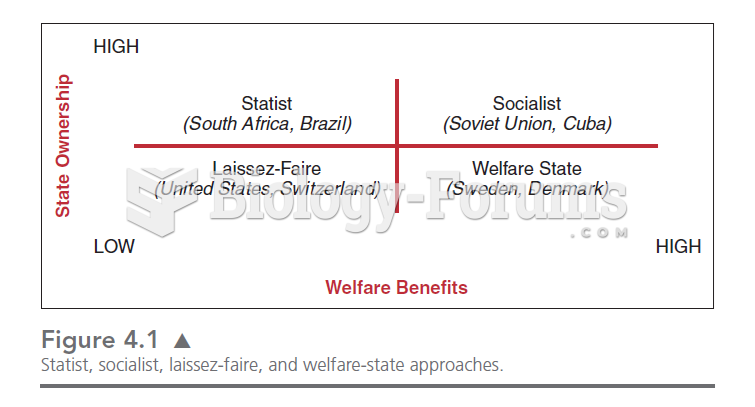 This chart illustrates the four quadrants in which we can place the relationships between the state
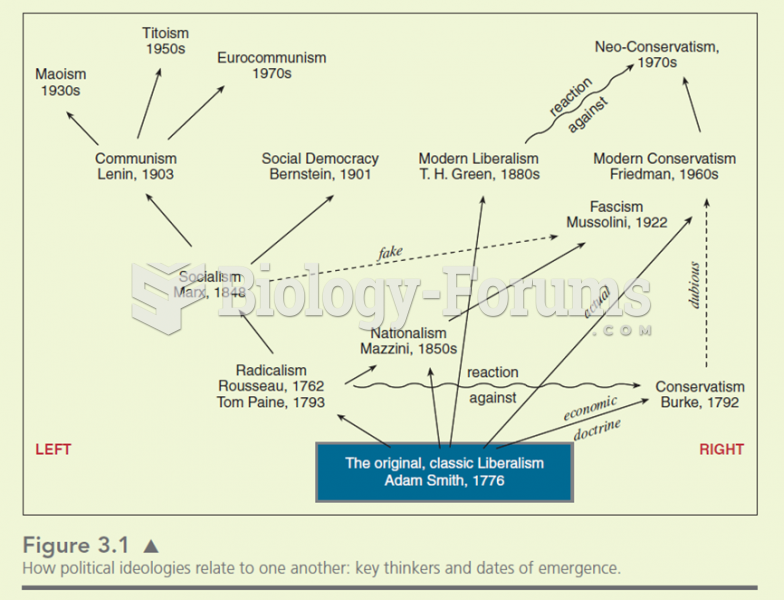 Many ideologies stem from older theories. The ideas of the philosophers are simplified. Ideologies
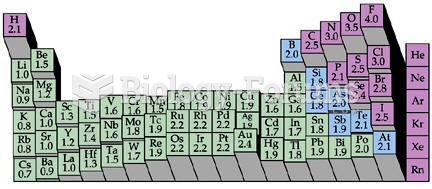 Electronegativity Chart (Periodic Table)
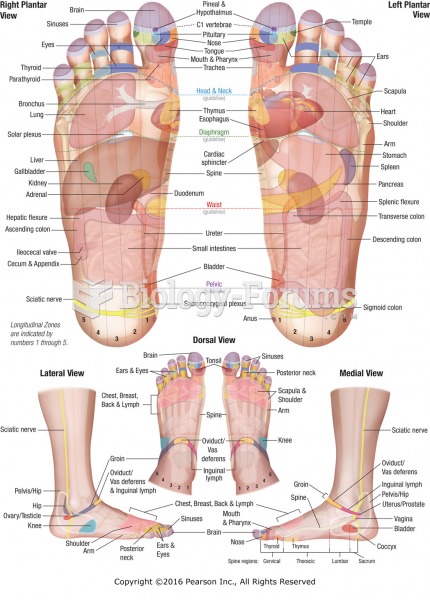 Reflexology chart showing location of reflexes with corresponding anatomical structures and organs ...
 The hypothalamic–pituitary–adrenal axis