|
|
|

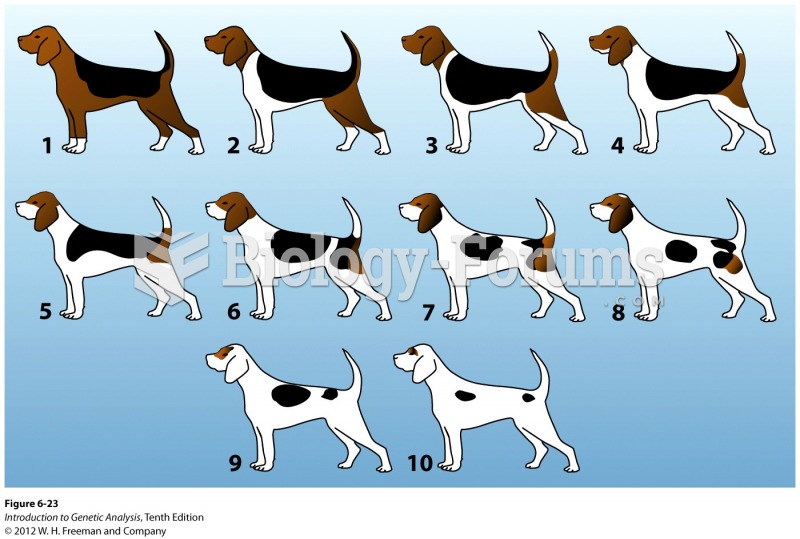 Variable expressivity
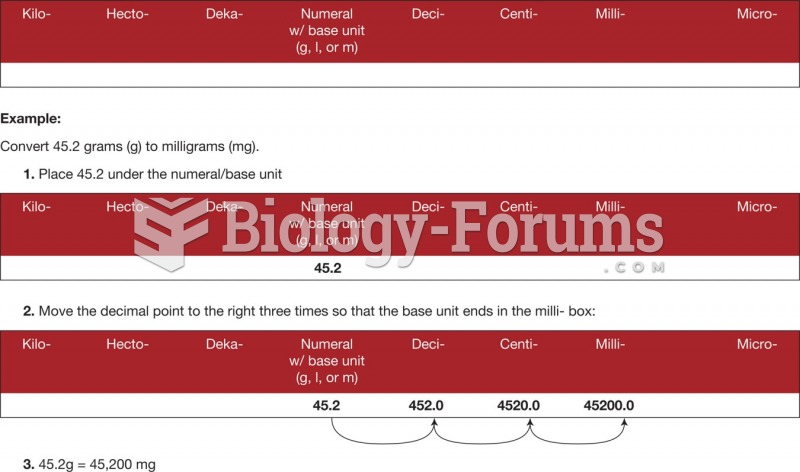 Metric conversion using the place value chart.
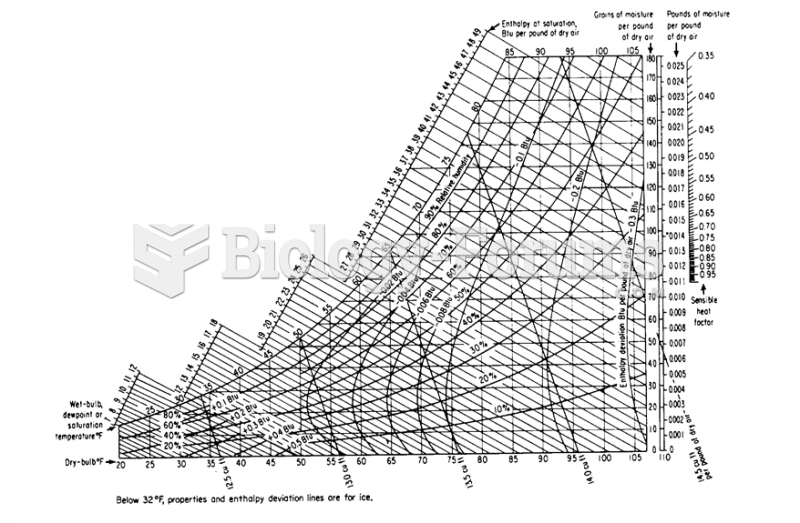 Humidity Chart
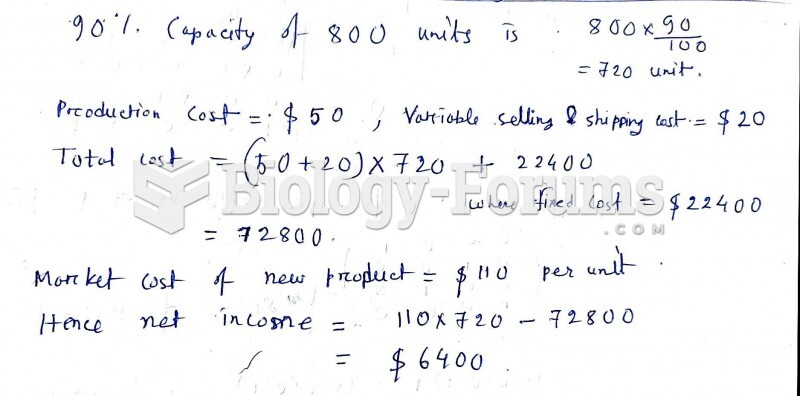 Excel hardware is introducing a new product on a new product line of capacity 800 units per ...
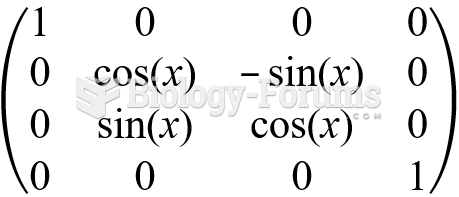 To rotate a matrix along the x-axis
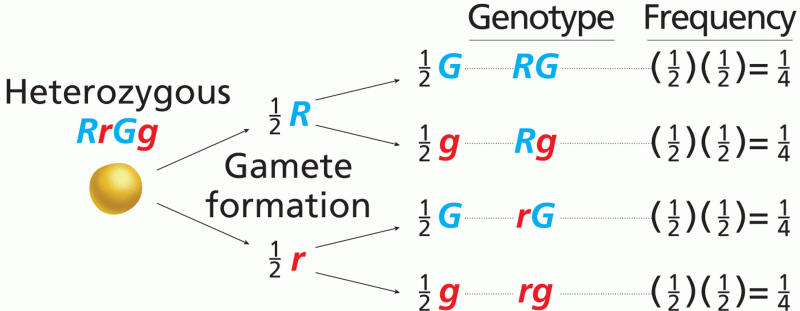 The forked-line method for determining gamete genotype frequency