|
|
|

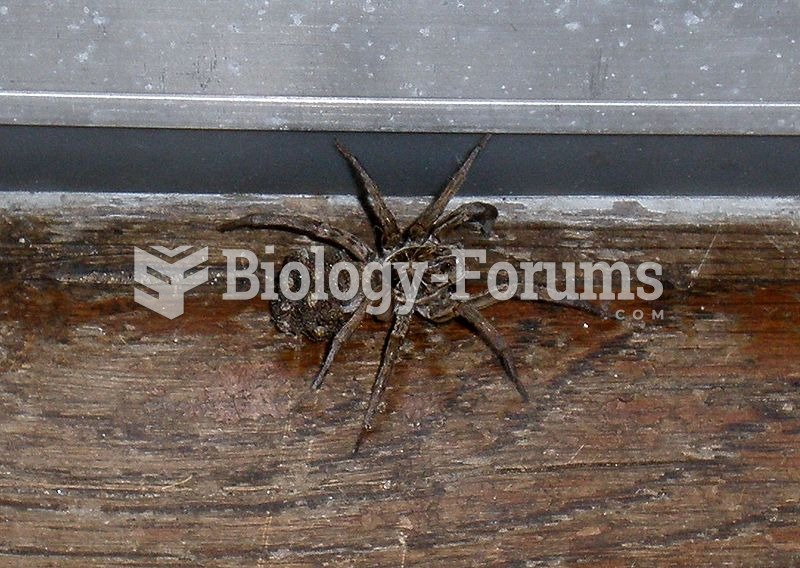 Large Wolf Spider with young in Michigan
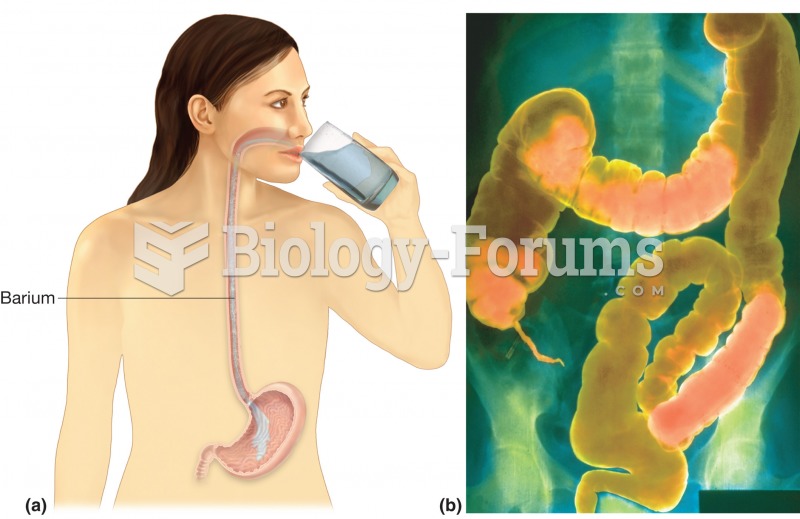 GI series. (a) Upper GI series begins with a barium swallow, barium shake, or barium meal. (b) Lower
 Large-Flowered Leafcup
 Ardipithecus kadabba has large canine teeth that are only slightly smaller than those of living apes
 Both students with intellectual disability (ID) and students who are intellectually gifted need ...
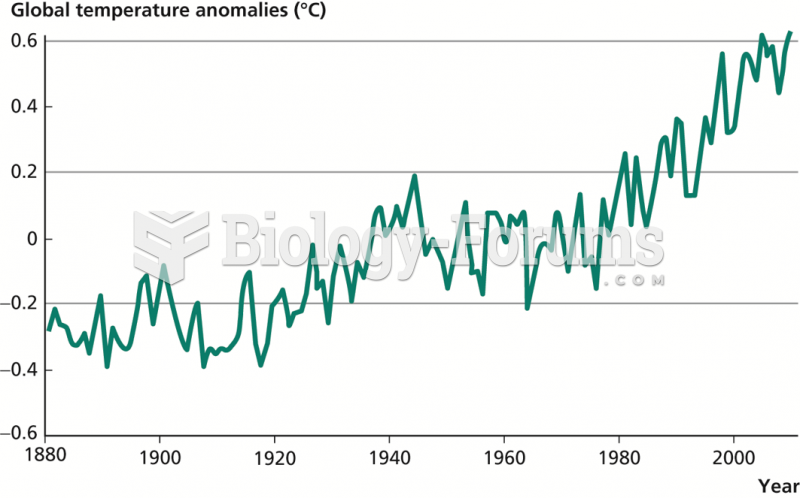 Average Global Temperatures