|
|
|

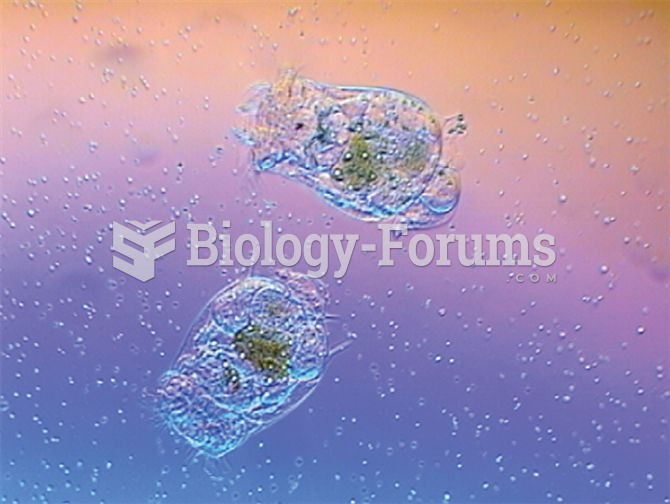 The rotifer, Brachionus calyciflorus, is a large predator that consumes the smaller algae, Chlorella
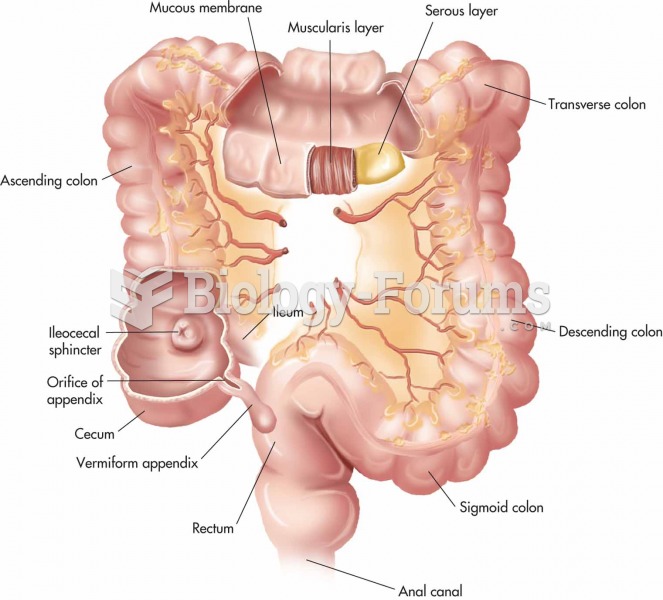 Large intestine.
 A typical large tool box, showing just one of many drawers.
 Suppose that we have a sample space with five equally likely experimental outcomes: E1, E2, E3, ...
 Average Precipitation Acidities and the Effects of Acid Rain
 The large, white flowers of giant saguaro cactus (Carnegiea gigantea) produce sweet nectar. The flow