|
|
|

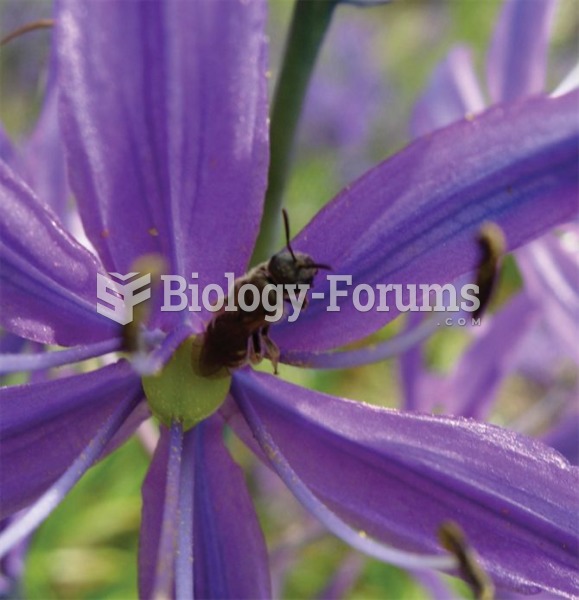 Mutualisms, such as those that occur among plants and pollinators, generally involve large numbers o
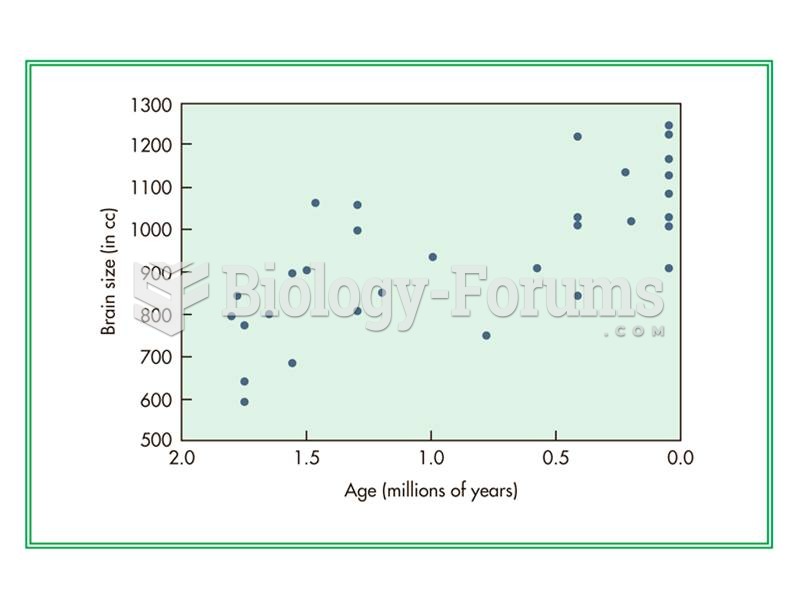 Although average brain size increases gradually though time in H. erectus, individuals with small br
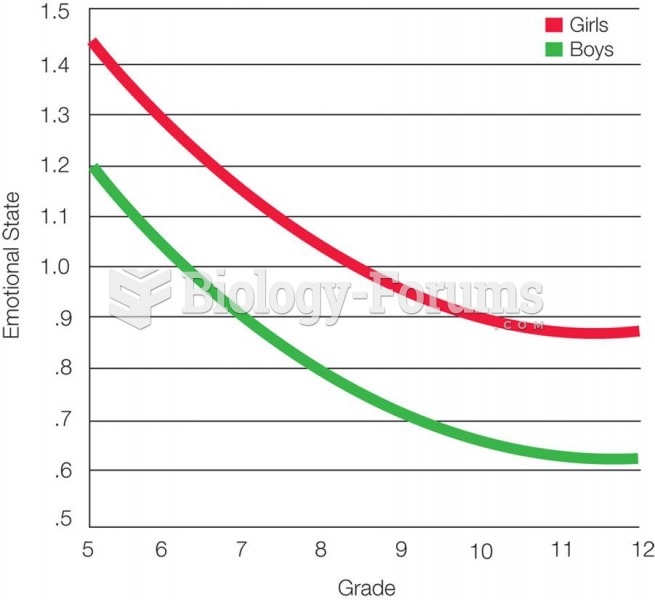 Change in Emotional States During Adolescence Average emotional state becomes teadilyi more negativ
 To help his students understand the term generalized other, Mead used baseball as an illustration. ...
 Sample root cause analysis: Duplicate dose of a narcotic analgesic.
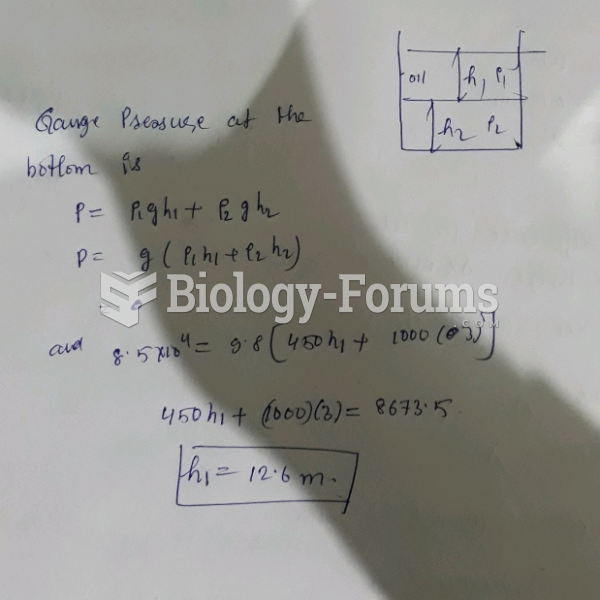 As shown in the figure, a large open tank contains a layer of oil ( density 450 kg/m3) floating ...