|
|
|

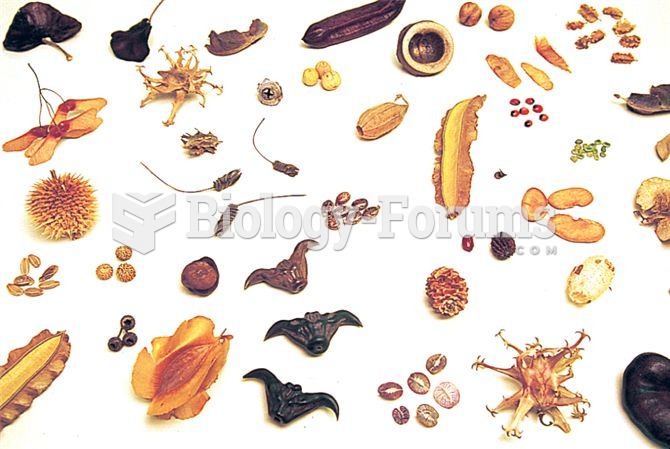 A small sample of the great diversity of seed sizes and shapes.
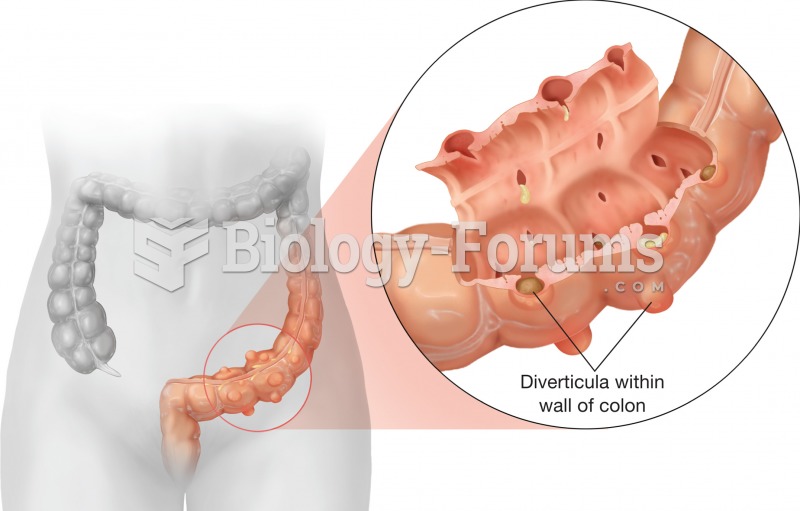 Diverticulosis. It is the presence of abnormal pouches in the wall of the large intestine (diverticu
 Oil Refineries Are Large and Complex Facilities
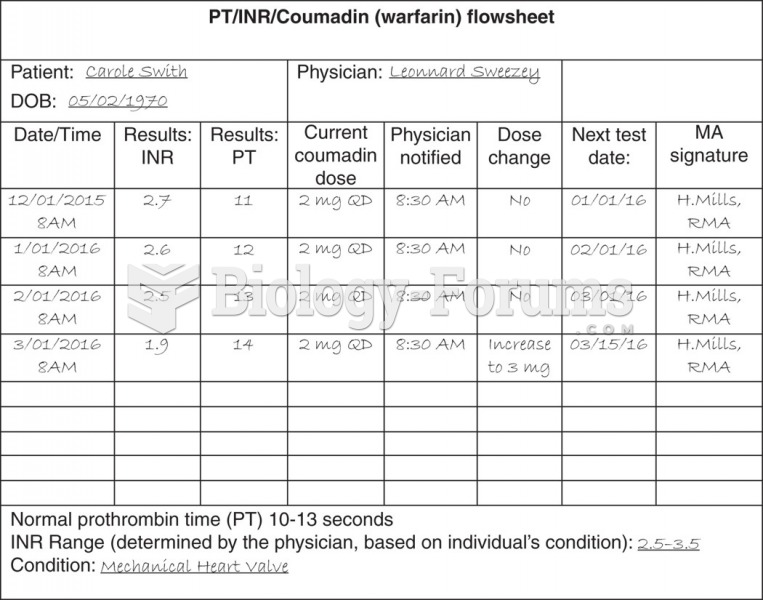 A sample flow sheet.
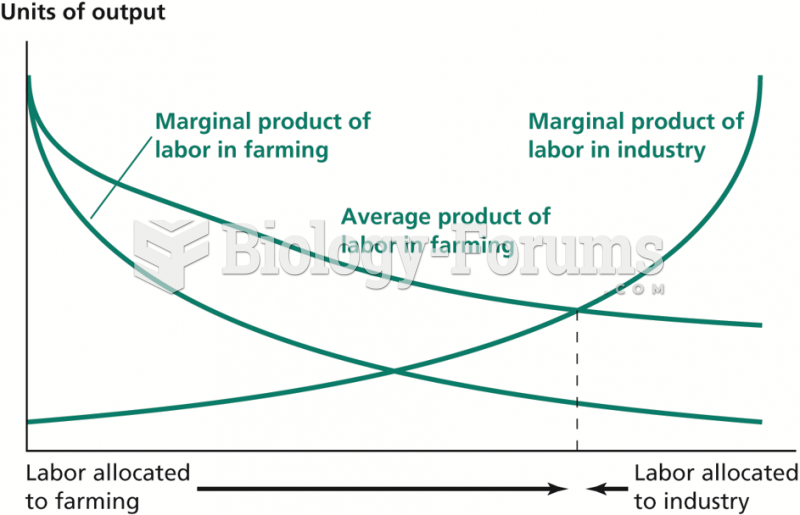 Overallocation of Labor to Farming When Farmworkers Are Paid Their Average Product
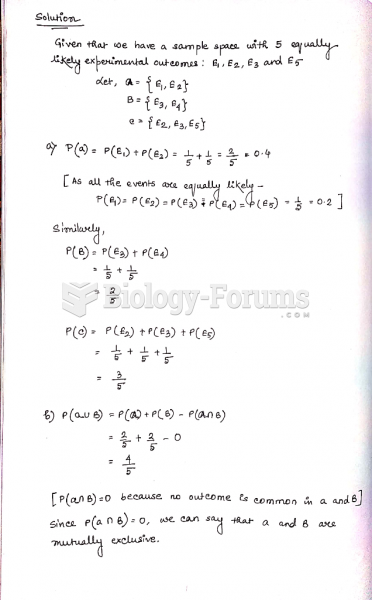 Suppose that we have a sample space with five equally likely experimental outcomes: E1, E2, E3, ...