|
|
|

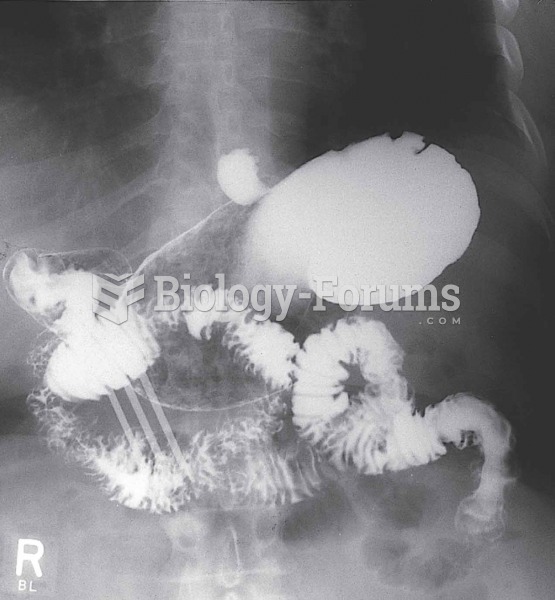 Upper GI series.
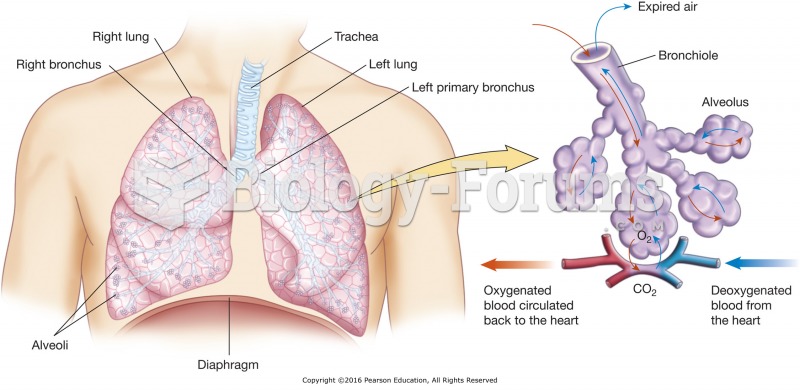 The lower respiratory tract and the process of gas exchange.
 Write the equation in general form of the line passing through the point
 How to find the equation of a line that is perpendicular to a line passing through a point
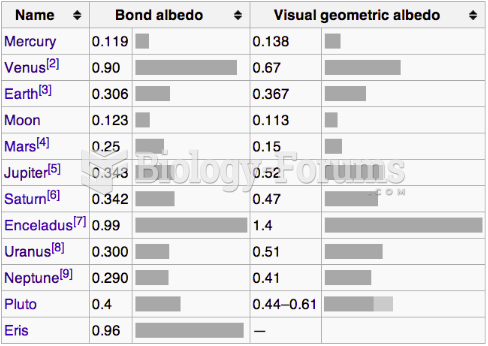 Albedo Chart
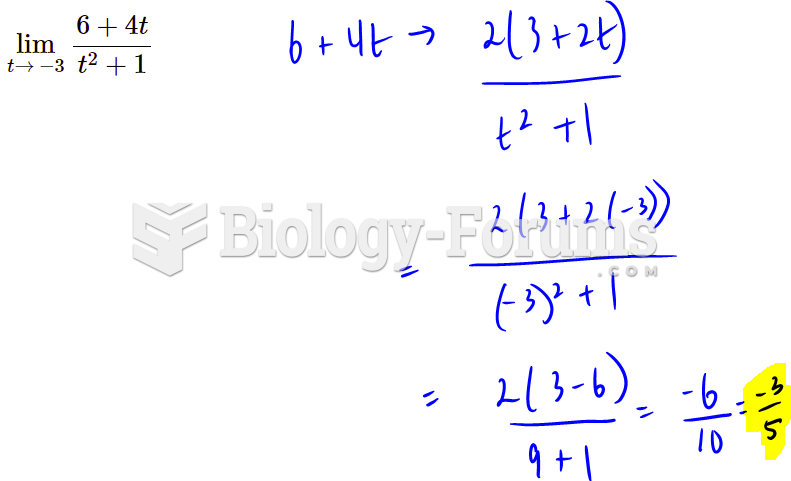 Computing Limits Problems