|
|
|

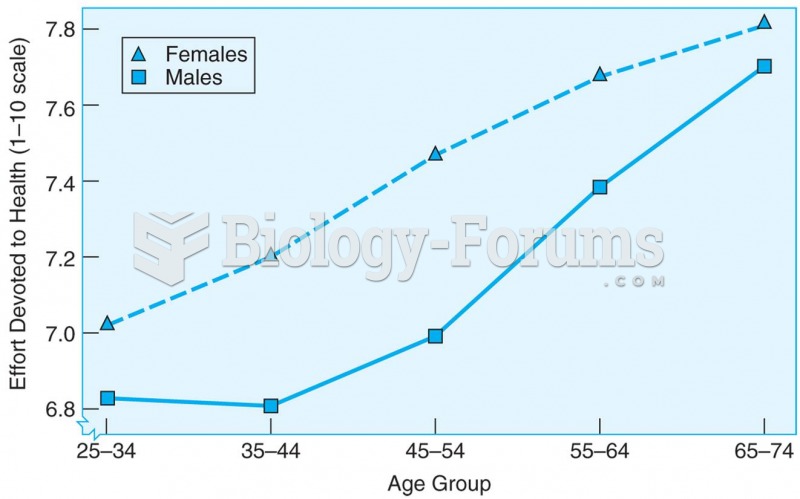 Cross-sectional data showing that the amount of effort spent on personal health care increases with
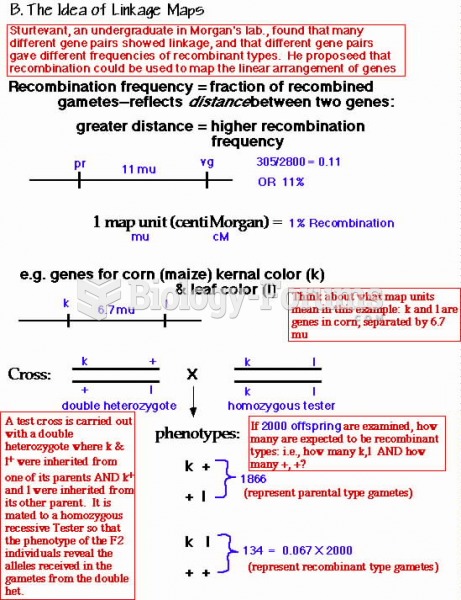 recombination frequency
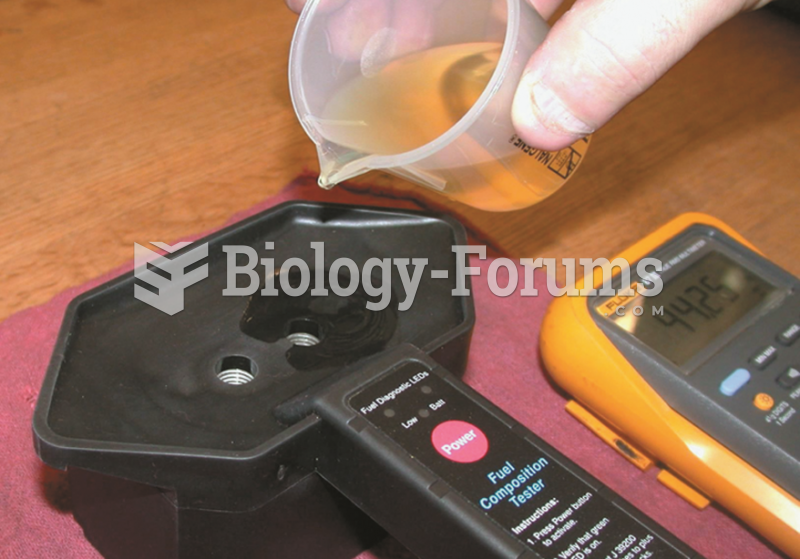 After verifying that the tester is capable of correctly reading the air frequency, gasoline is ...
 Demographic Data for India
 Frequency Analysis of Letters Used in the English Language
 Chi-Square Analysis of Mendel’s Trihybrid-Cross Data