Did you know?
There are immediate benefits of chiropractic adjustments that are visible via magnetic resonance imaging (MRI). It shows that spinal manipulation therapy is effective in decreasing pain and increasing the gaps between the vertebrae, reducing pressure that leads to pain.
Did you know?
Tobacco depletes the body of vitamins A, C, and E, which can result in any of the following: dry hair, dry skin, dry eyes, poor growth, night blindness, abscesses, insomnia, fatigue, reproductive system problems, sinusitis, pneumonia, frequent respiratory problems, skin disorders, weight loss, rickets, osteomalacia, nervousness, muscle spasms, leg cramps, extremity numbness, bone malformations, decayed teeth, difficulty in walking, irritability, restlessness, profuse sweating, increased uric acid (gout), joint damage, damaged red blood cells, destruction of nerves, infertility, miscarriage, and many types of cancer.
Did you know?
The modern decimal position system was the invention of the Hindus (around 800 AD), involving the placing of numerals to indicate their value (units, tens, hundreds, and so on).
Did you know?
IgA antibodies protect body surfaces exposed to outside foreign substances. IgG antibodies are found in all body fluids. IgM antibodies are the first type of antibody made in response to an infection. IgE antibody levels are often high in people with allergies. IgD antibodies are found in tissues lining the abdomen and chest.

 Amino acid chart
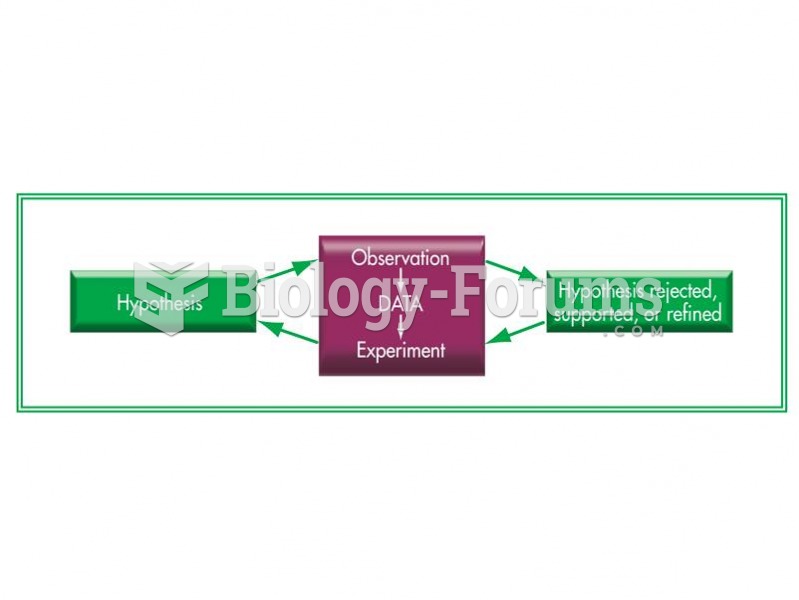 The scientific method.
 A medical assistant holds a specimen container to receive a biopsy sample.
 Humidity Chart
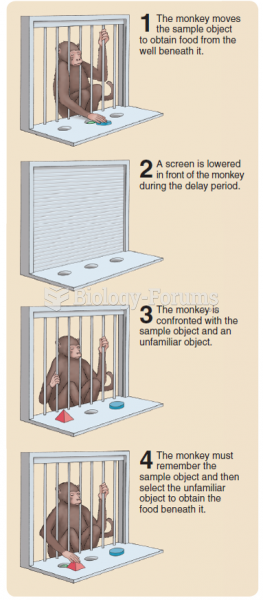 Performance of a delayed nonmatching-to-sample trial.
 Scientific process and the scientific method