|
|
|

 Motion of the barycenter of the Solar System relative to the Sun
 The relative influence of heredity and the environment in human behavior has fascinated and plagued ...
 Identical twins share 100 percent of their segregating genes.
 Display piece, Yoruba culture.
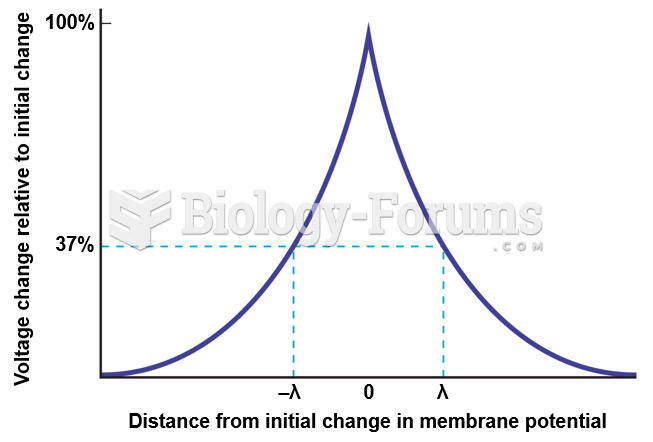 Distance from Initial Change in Membrane Potential vs. Voltage Change Relative to Initial Change
 Adding additional amounts of ethyl alcohol (ethanol) increases the frequency reading.