This topic contains a solution. Click here to go to the answer
|
|
|

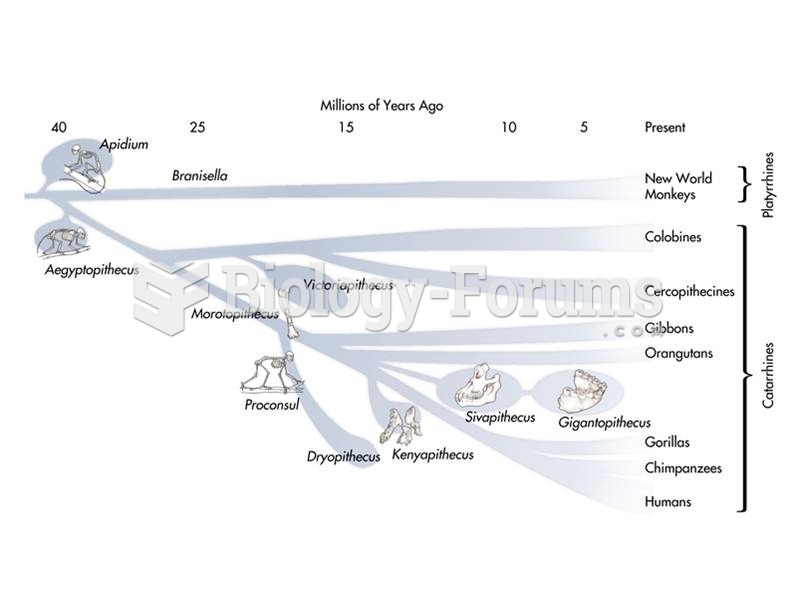 Proposed relationships between living and fossil platyrrhines and catarrhines.
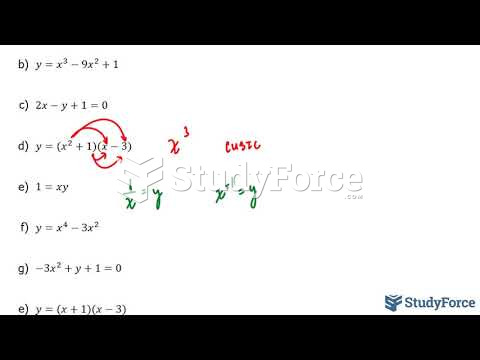 How to classify whether an equation is linear, quadratic, or cubic
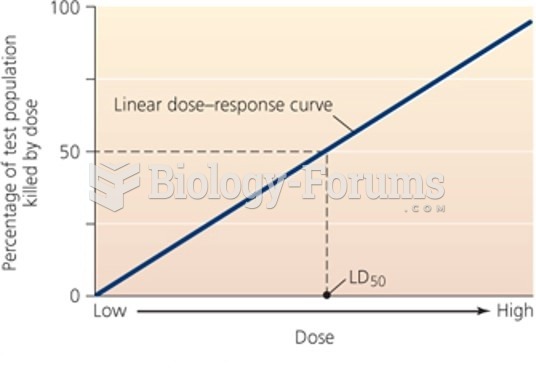 Linear dose-response curve
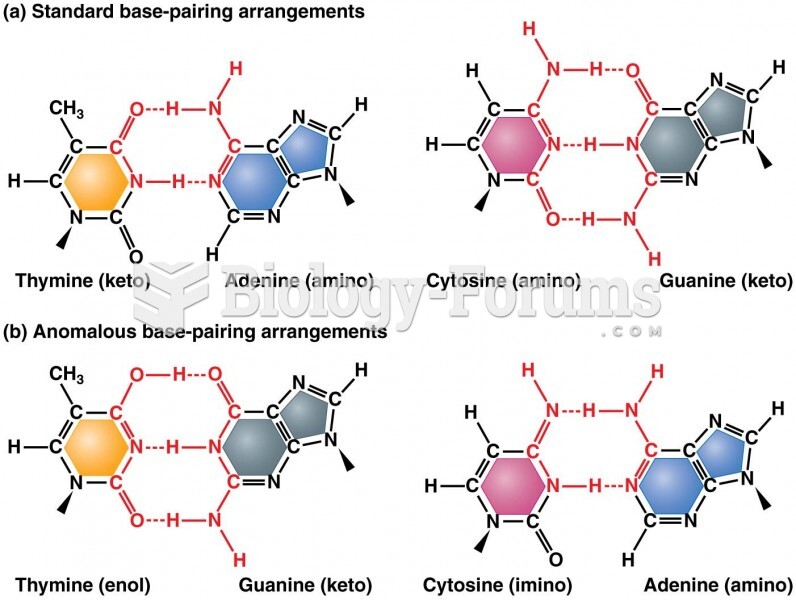 Standard base-pairing relationships
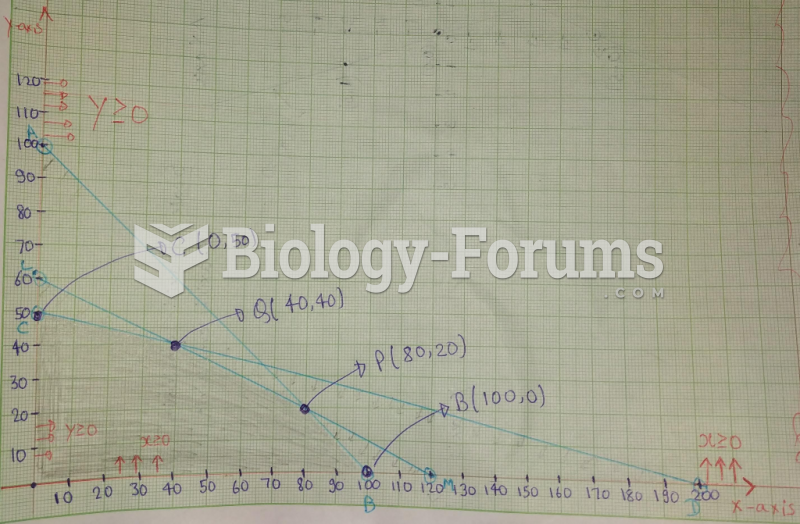 Linear programming problems using the simplex method.
 The tree of life, highlighting the phylogenetic relationships