|
|
|

 The deer mouse and the African elephant represent extremes among mammals of r versus K selection.
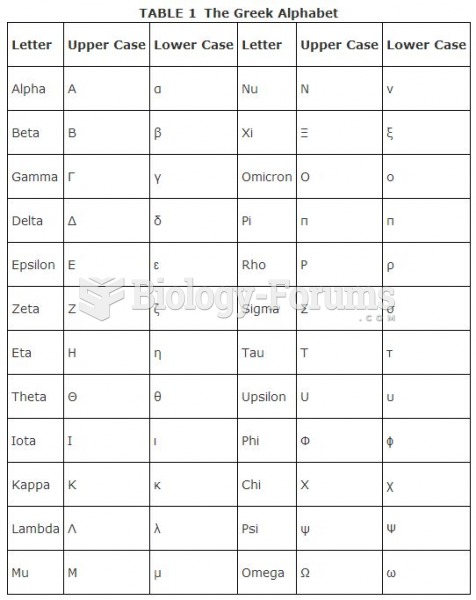 Greek Alphabet Chart
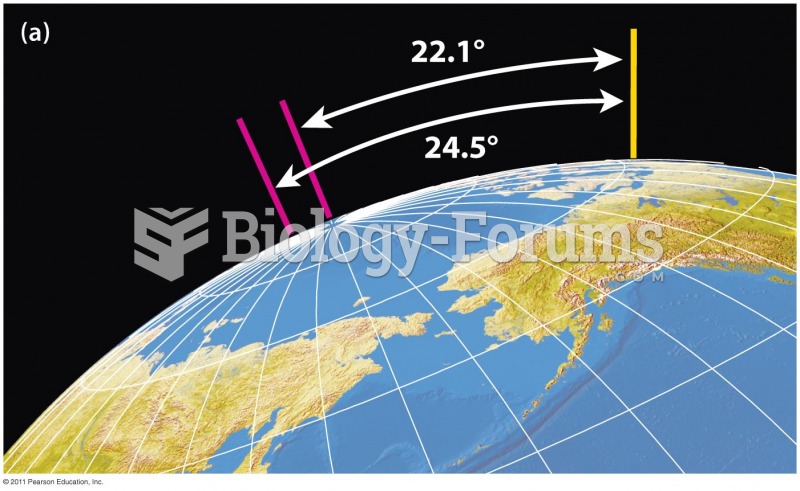 How Axis Tilt Affects the Intensity of Solar Radiation
 Eleanor Antin, My Kingdom Is the Right Size, from the series The King of Solana Beach.
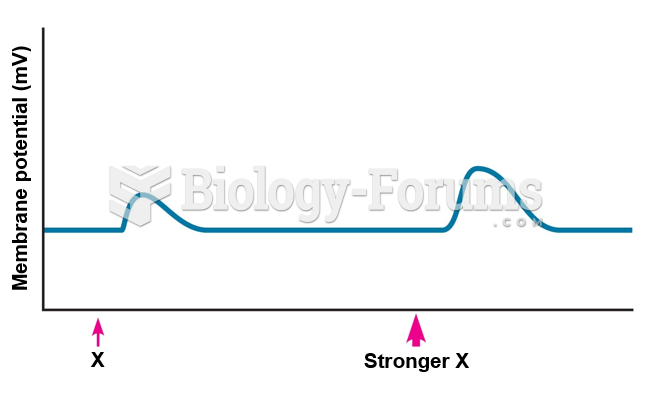 Effect of stimulus strength on size of graded potential.
 The Lund and Browder Chart