|
|
|

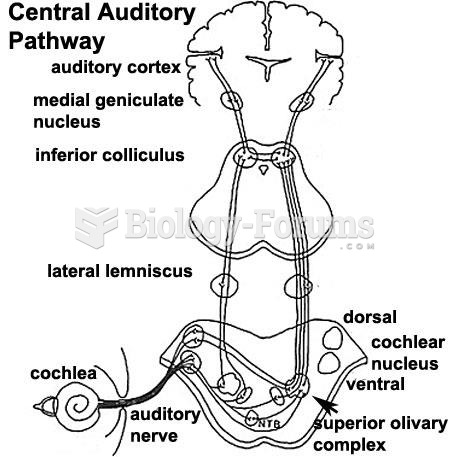 Hearing process
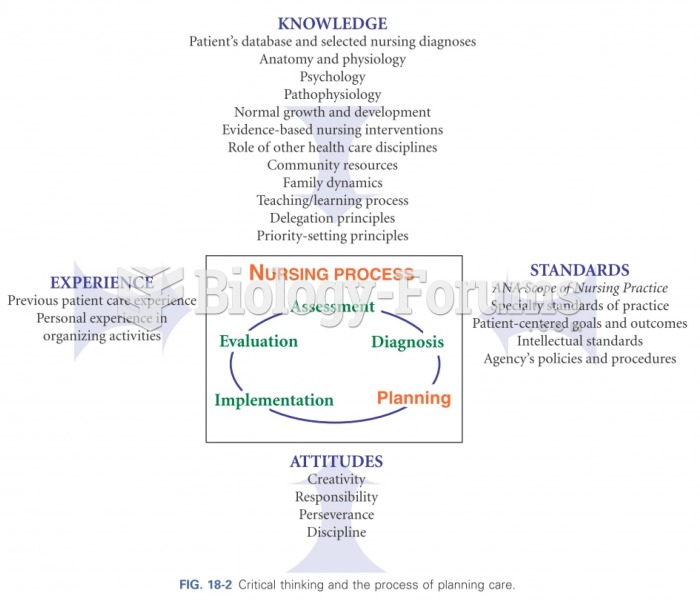 Critical thinking and the process of planning care
 Islam in Central Asia
 How Does Earth Work? Physical Geology and the Process of Science, 2nd Edition
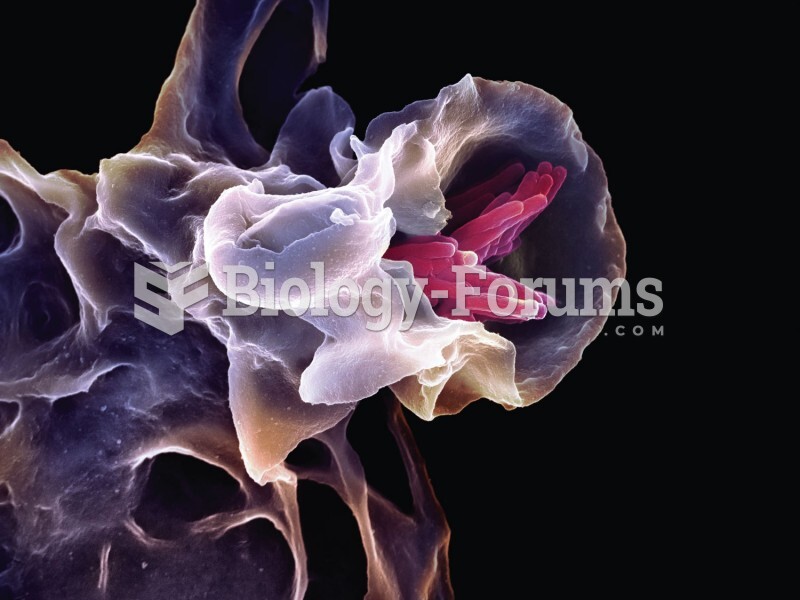 Macrophage caught in the process of engulfing tuberculosis bacteria.
 Consequences of sleep deprivation flow chart