|
|
|

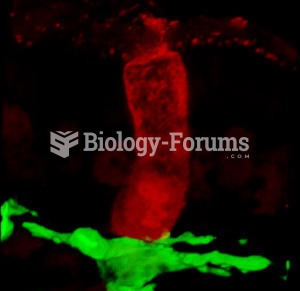 Goblet cells that line the intestine
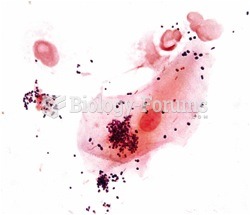 Gram Stain of a person's Gum line
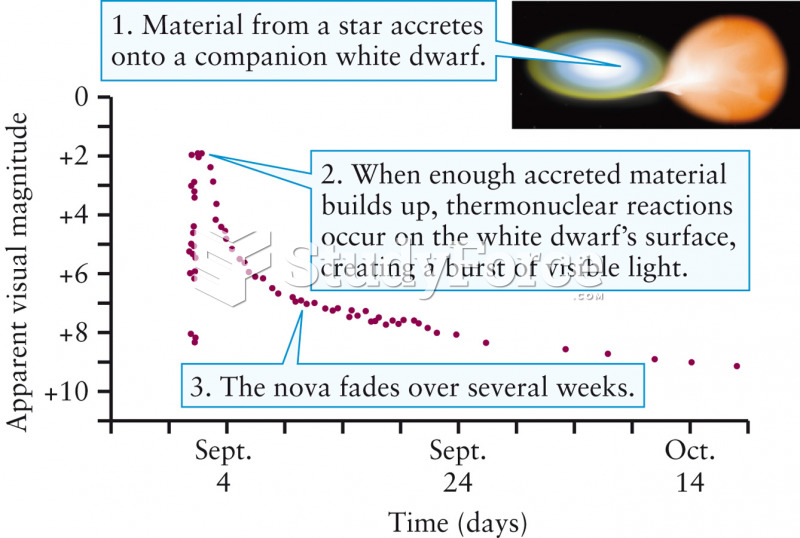 The Light Curve of a Nova
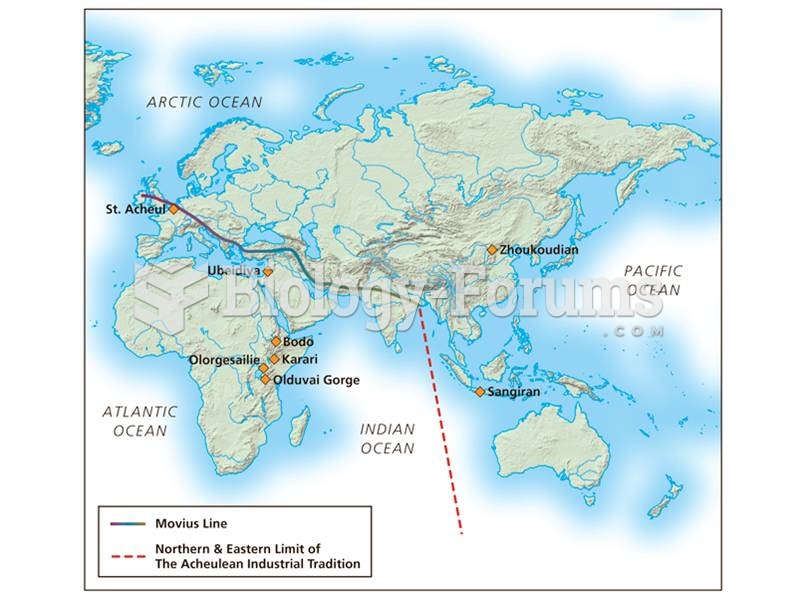 The Movius line separates regions of the world where Acheulean hand axes were made from regions wher
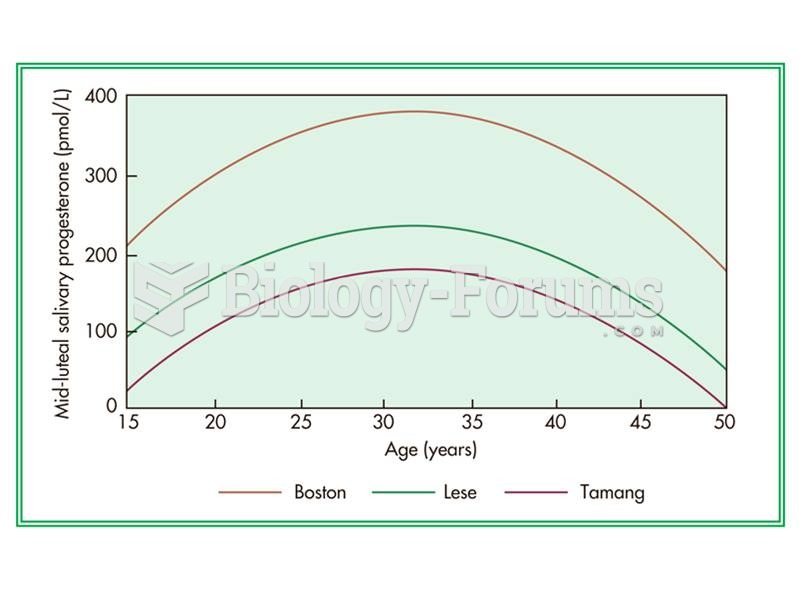 The age-dependent curve of salivary progresterone levels in three populations.
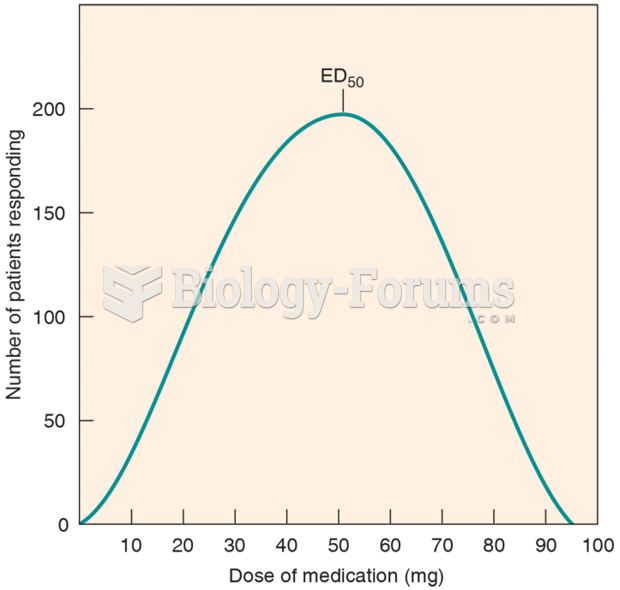 The Frequency Distribution Curve of a Drug