|
|
|

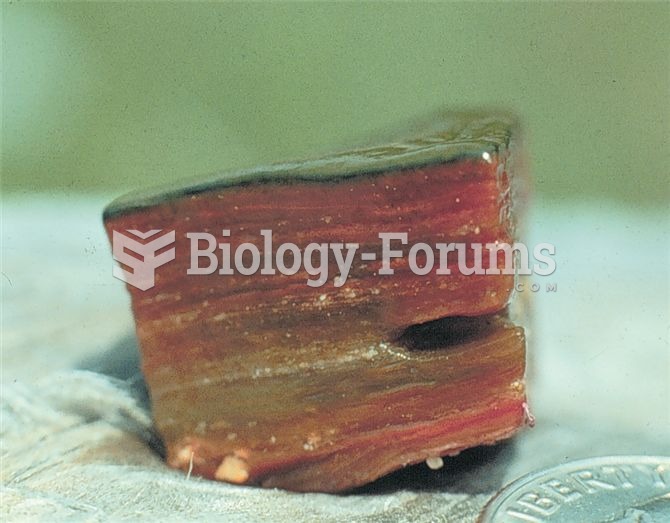 Cyanobacteria of the (a) genus Synechococcus form (b) mats that line hot springs around the world.
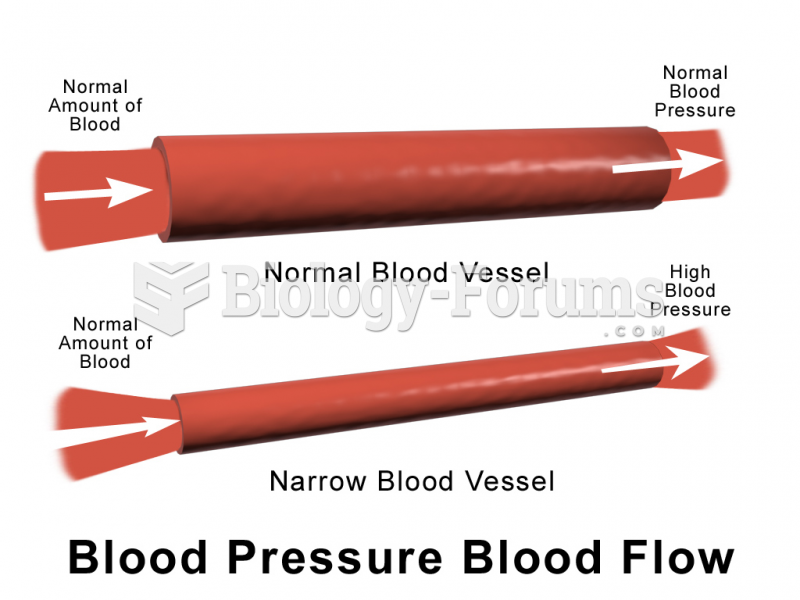 Blood pressure and blood volume relationship
 Bell Curve Joke
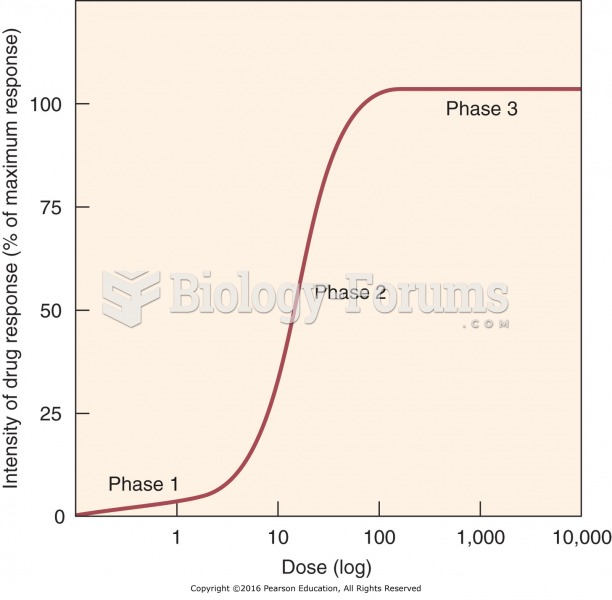 Dose–response relationship.
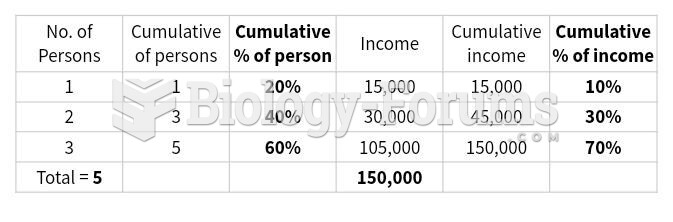 Construct a Lorenz curve that shows income distribution in this society.
 The forked-line method for determining gamete genotype frequency