|
|
|

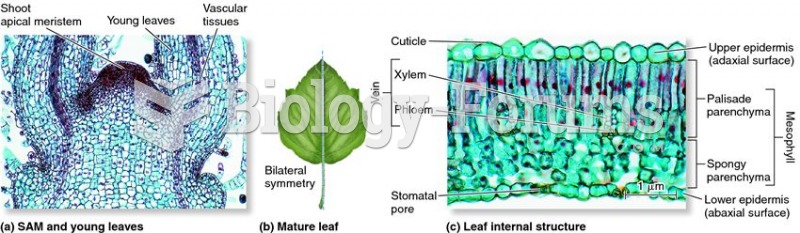 Eudicot leaf development and structure.
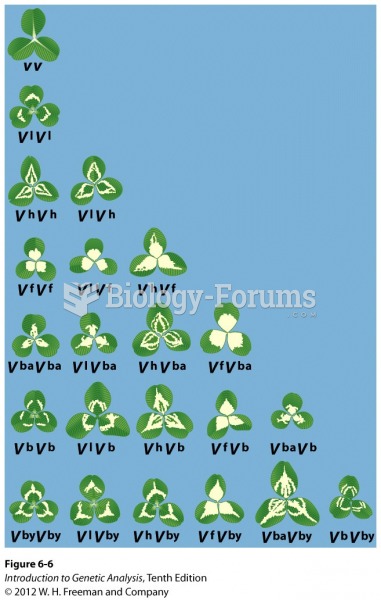 Seven alleles and their interactions in leaf patterning of clover
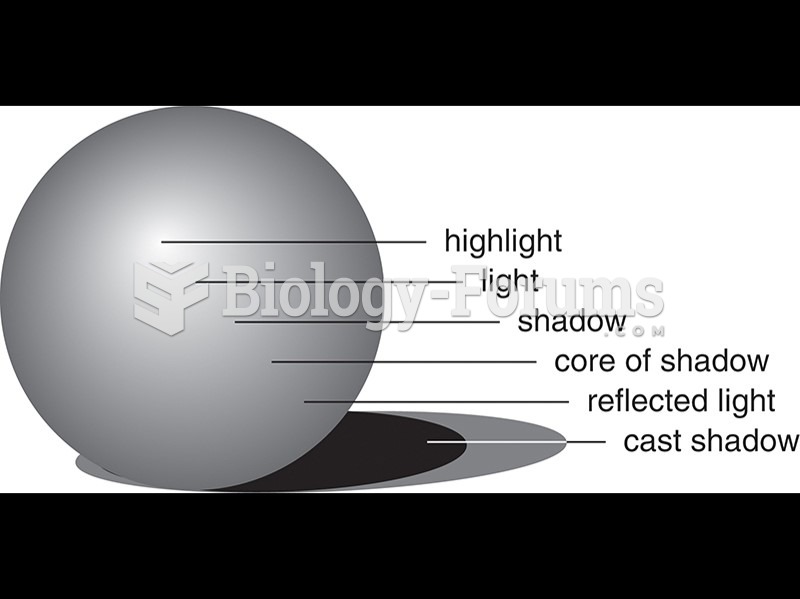 A sphere represented by means of modeling.
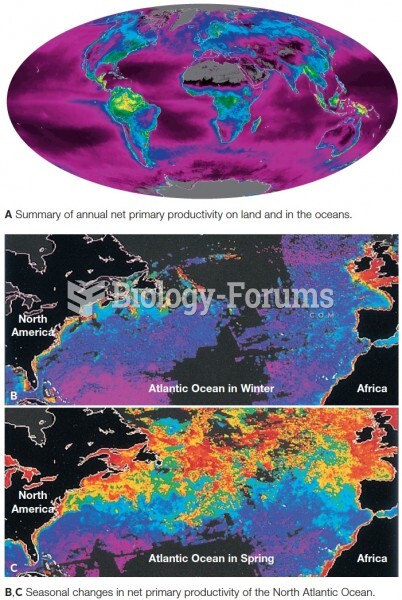 Satellite data showing net primary production. Productivity is coded as red (highest) down through o
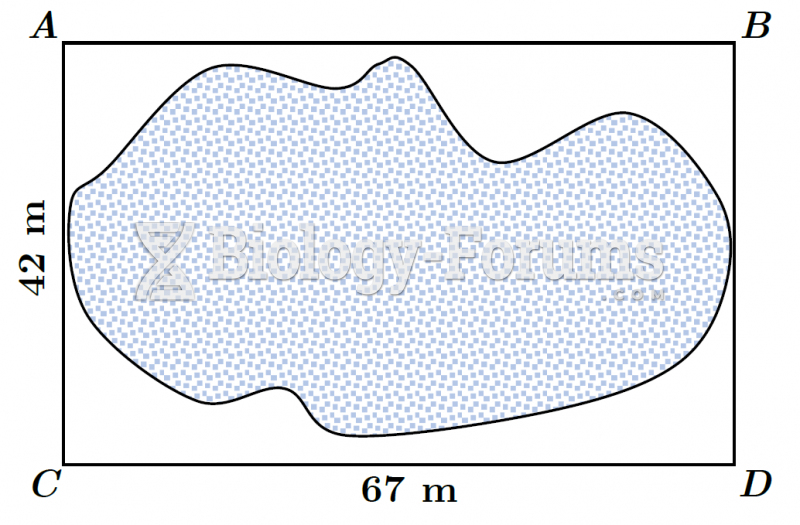 Plot of Land (Modified Offset Method) - Boxed
 The Hfr chromosome time-of-entry map is assembled from the recombinant data