|
|
|

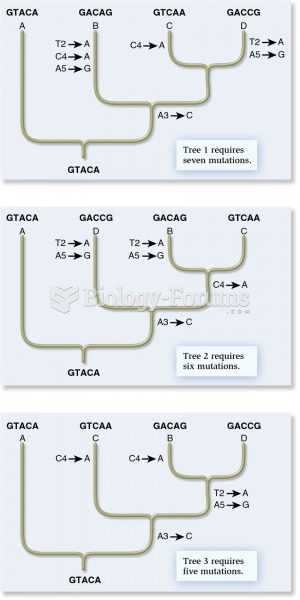 The cladistic approach from molecular genetic data
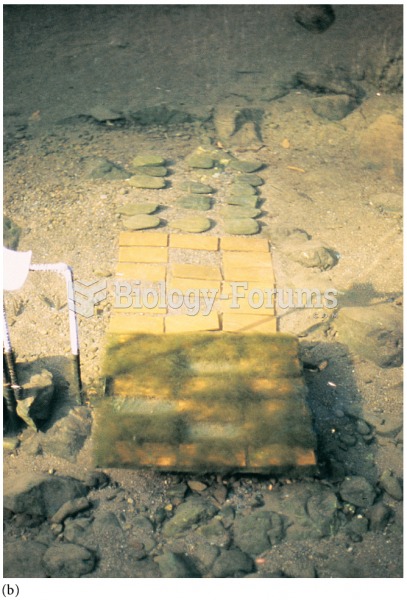 Effects of excluding Helicopsyche borealis on benthic algal biomass: (a) two sets of tiles at the be
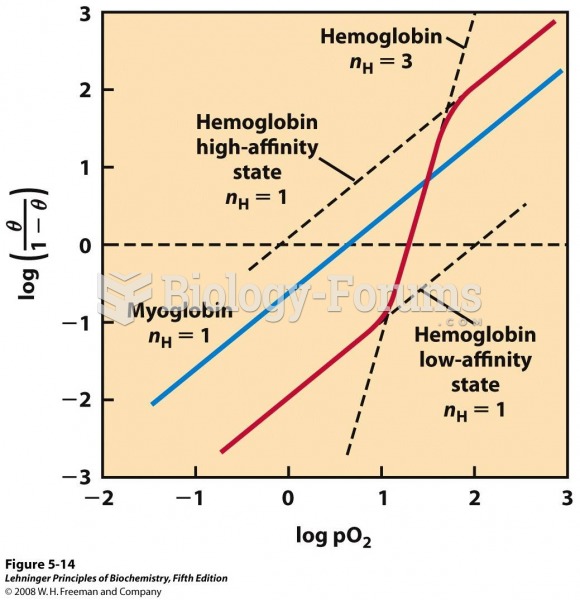 Hill plots for oxygen binding to myoglobin and hemoglobin
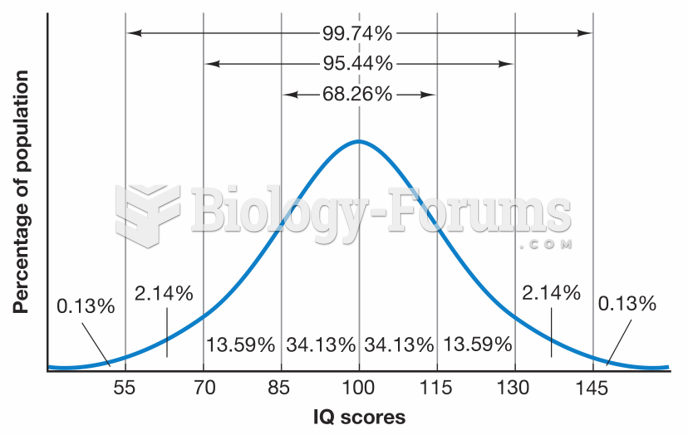 Expected Distribution of IQ Scores
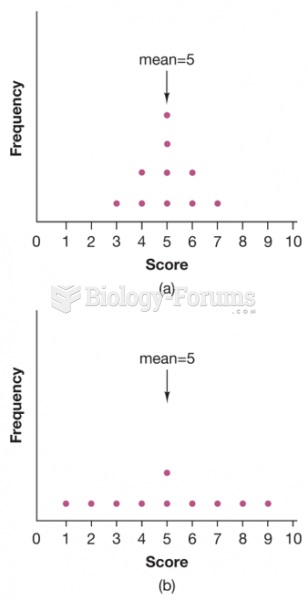 . In which distribution is the mean more “typical” of all scores?
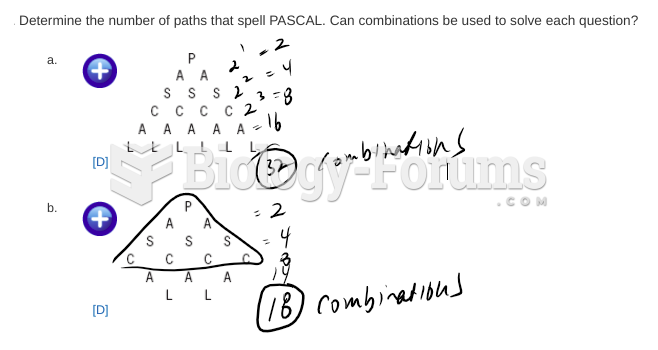 Data management questions