|
|
|

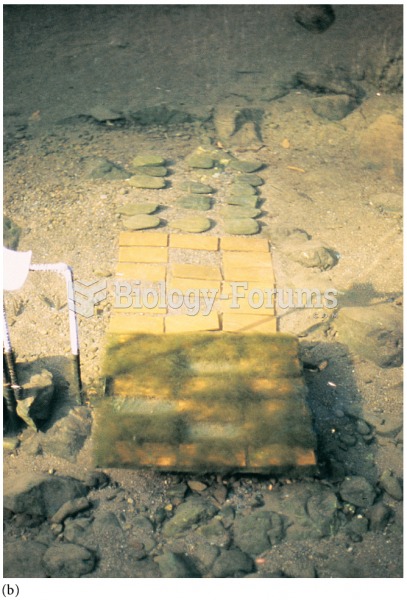 Effects of excluding Helicopsyche borealis on benthic algal biomass: (a) two sets of tiles at the be
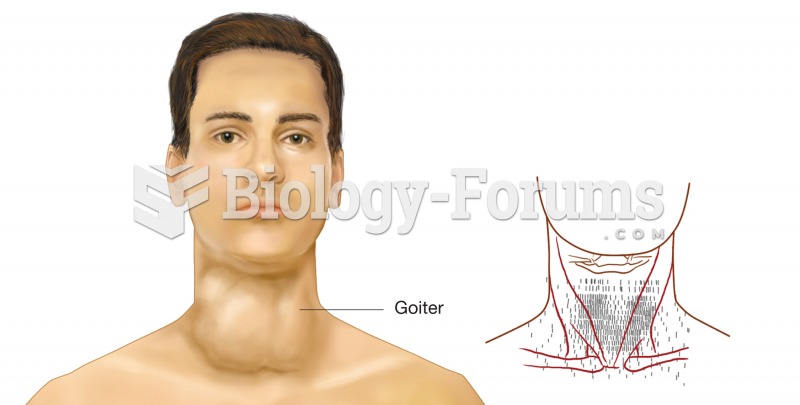 Thyroid scan. The right image is the data from a thyroid scan, printed on a superimposed map of the
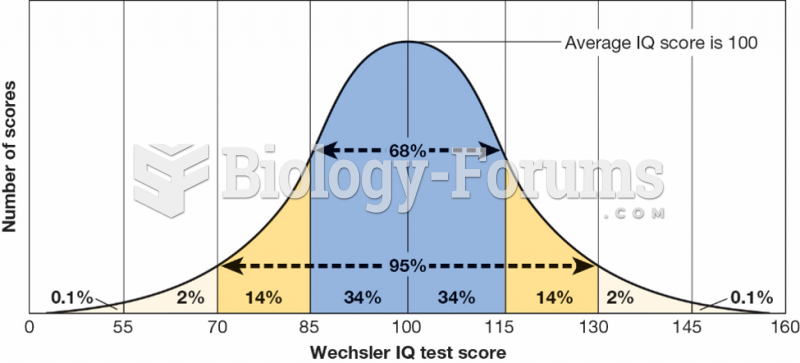 Normal Distribution of IQ Scores
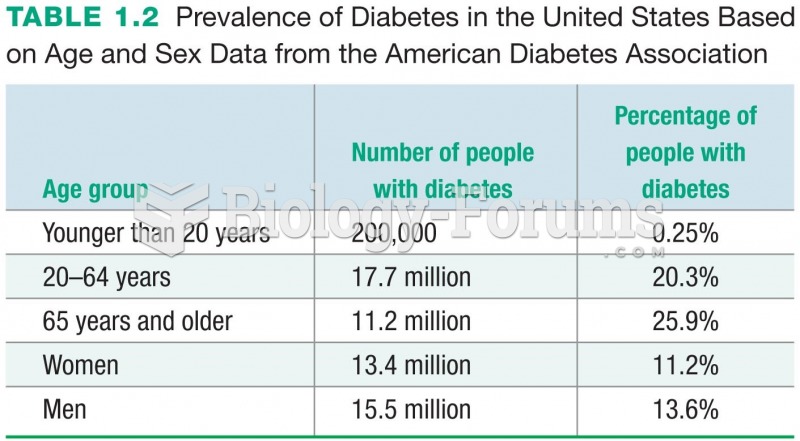 Prevalence of Diabetes in the United States Based on Age and Sex Data from the American Diabetes ...
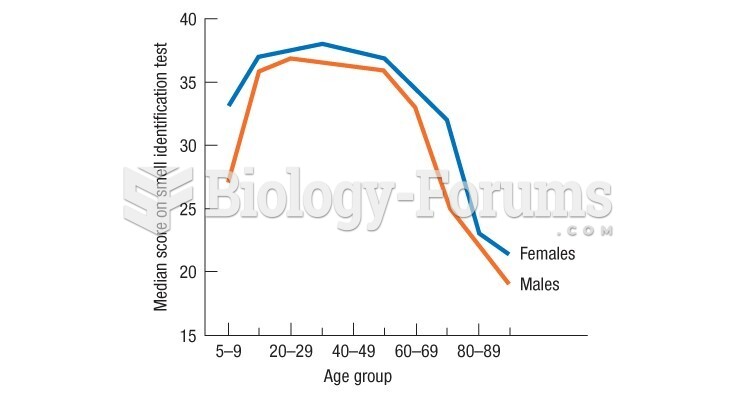 Doty's data show a very rapid drop in late adulthood in the ability to identify smells
 Data for a Hypothetical Paternity Test Using 13 CODIS Genes