|
|
|

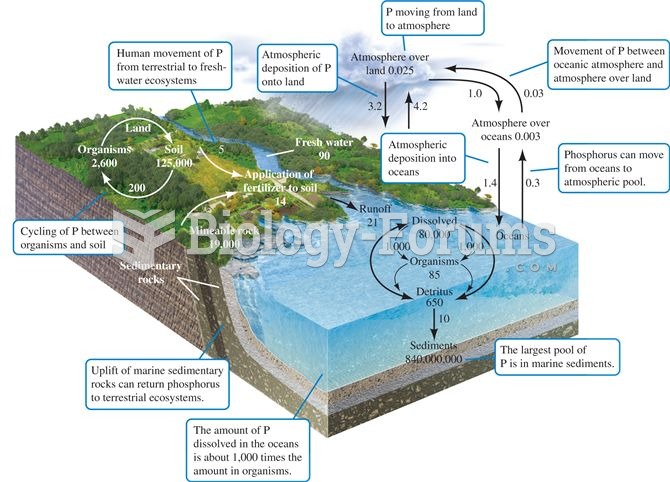 The phosphorus cycle. Numbers are 1012 g P or fluxes as 1012 g P per year (data from Schlesinger 199
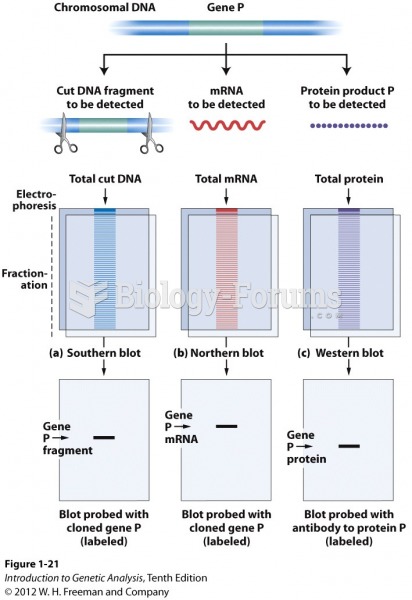 Probes can be used to detect specific macromolecules
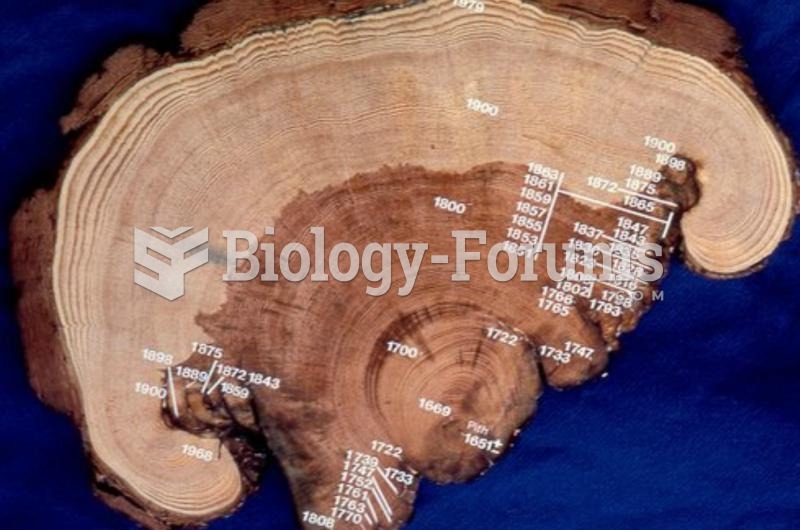 tree-ring data
 Critical thinking involves analysis in which the nurse examines patient data available from a variet
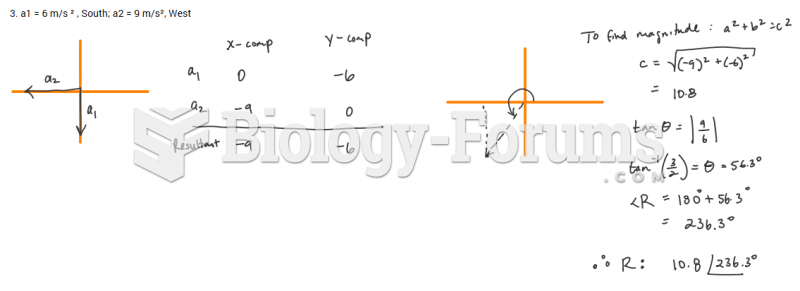 Solve for the resultant vector for the following sets of vectors using any of the different ...
 The Hfr chromosome time-of-entry map is assembled from the recombinant data