|
|
|

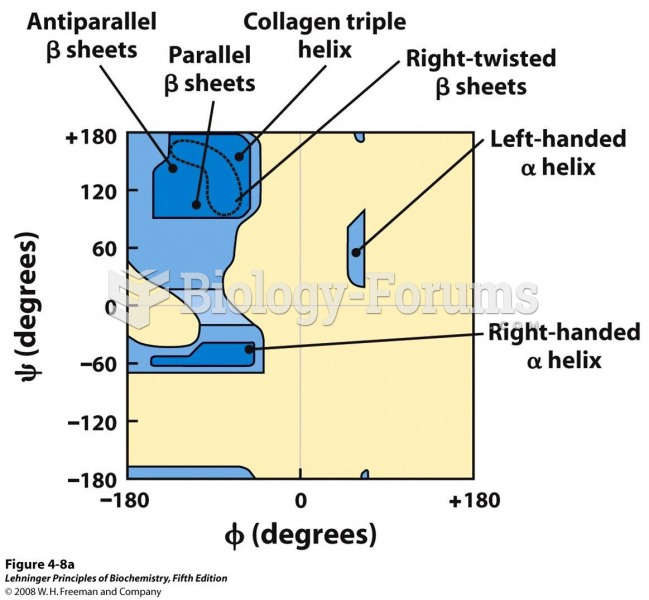 Ramachandran plots showing a variety of structures
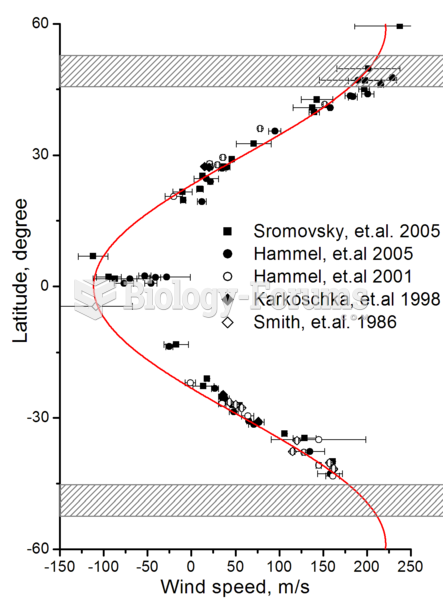 Zonal wind speeds on Uranus. Shaded areas show the southern collar and its future northern counterpa
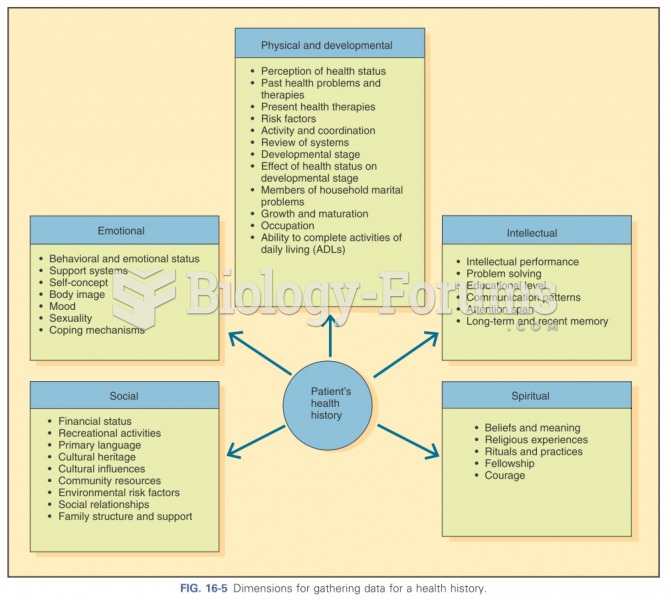 Dimensions for gathering data
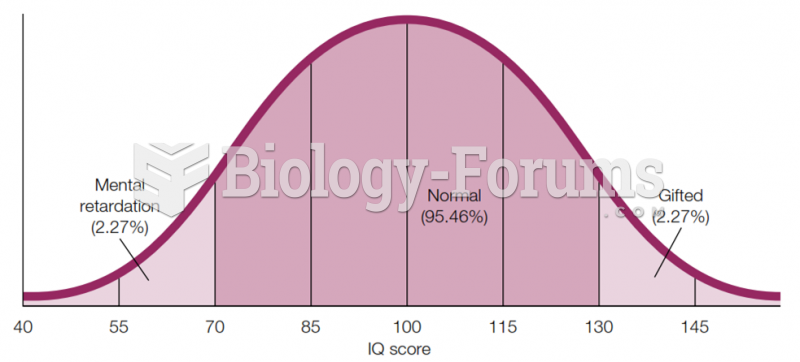 Bell Curve for Intelligence IQ scores for a population-based sample usually fall into this kind of
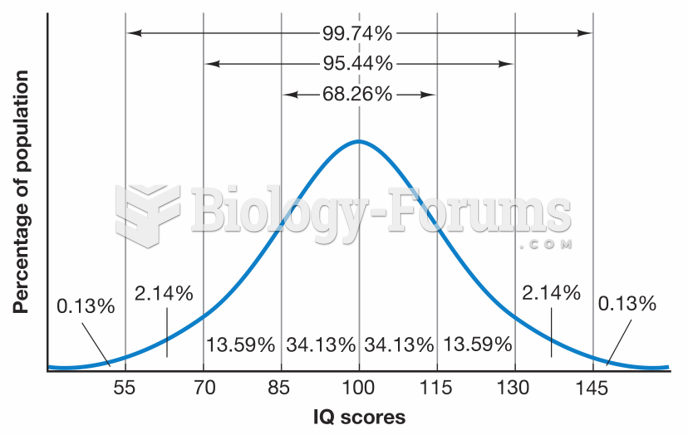 Expected Distribution of IQ Scores
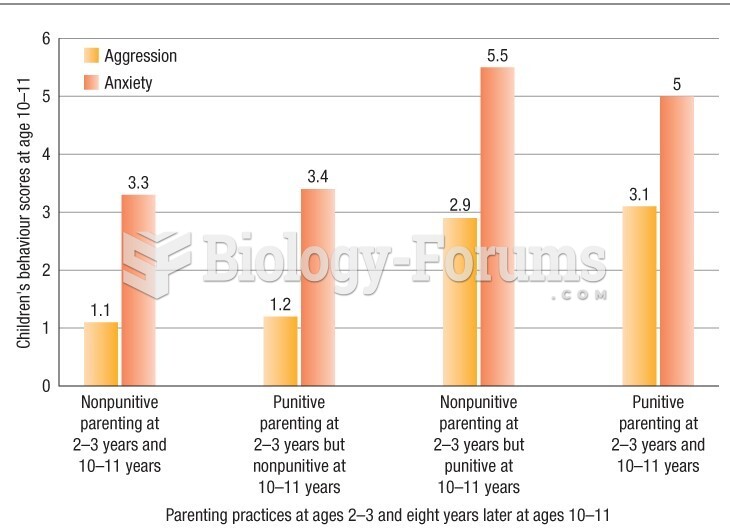 Children's behaviour rating scores on measures of aggression and anxiety