A company that fills soft drinks into bottles has established an -chart and an R-chart to monitor the average fill level in the bottles. To do this, the company has taken a series of samples of size n = 4 bottles. The overall average fill is 12.
03 ounces. The average range for the subgroups has been .06 ounces. Suppose, after developing the control chart, a subgroup of size 4 yields a sample mean of 12.09 ounces and a range of .08, which of the following statements is true?A) The process is in control on both the -chart and the R-chart.
B) The process is out of control on the R-chart but in control on the -chart.
C) The process is out of control on the -chart but in control on the R-chart.
D) The process is out of control on both the -chart and the R-chart.
Question 2
An industry study was recently conducted in which the sample correlation between units sold and marketing expenses was 0.57. The sample size for the study included 15 companies.
Based on the sample results, test to determine whether there is a significant positive correlation between these two variables. Use an alpha = 0.05A) Because t = 2.50 > 1.7709, do not reject the null hypothesis. There is not sufficient evidence to conclude there is a positive linear relationship between sales units and marketing expense for companies in this industry.
B) Because t = 2.50 > 1.7709, reject the null hypothesis. There is sufficient evidence to conclude there is a positive linear relationship between sales units and marketing expense for companies in this industry.
C) Because t = 3.13 > 1.7709, do not reject the null hypothesis. There is not sufficient evidence to conclude there is a positive linear relationship between sales units and marketing expense for companies in this industry.
D) Because t = 3.13 > 1.7709, reject the null hypothesis. There is sufficient evidence to conclude there is a positive linear relationship between sales units and marketing expense for companies in this industry.

 Soft-Coated Wheaten Terrier
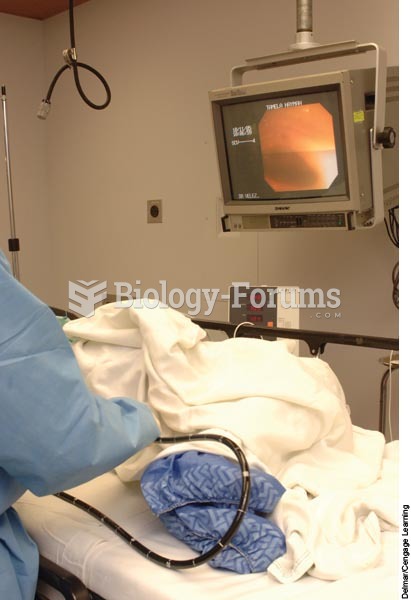 A physician is performing a colonoscopy on a client and viewing the internal structures of the colon
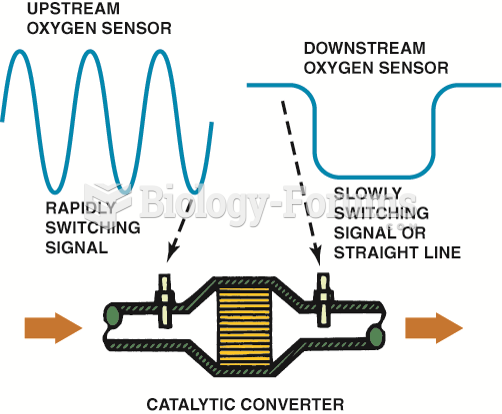 The OBD-II catalytic converter monitor compares the signals of the upstream and downstream O2Ss to ...
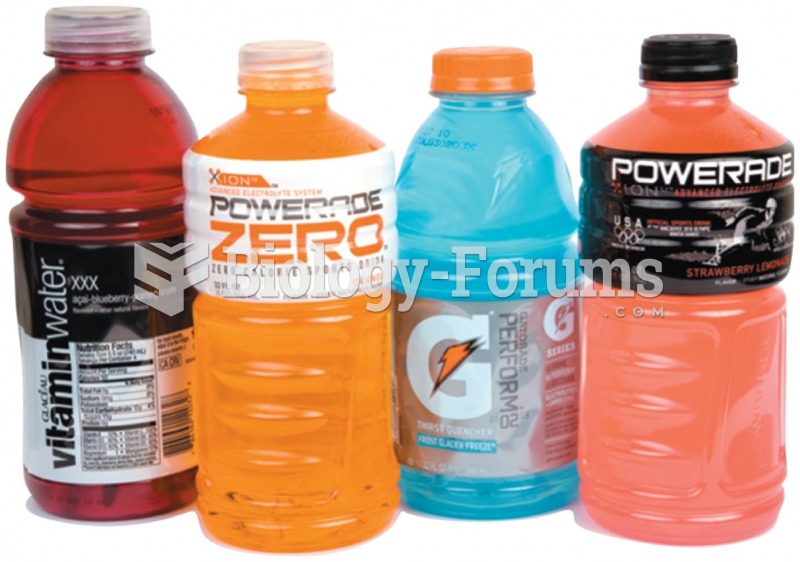 Sports drinks can replace electrolytes and fluids lost during exercise
 Using child-sized dishes at mealtimes can help caregivers monitor portion sizes
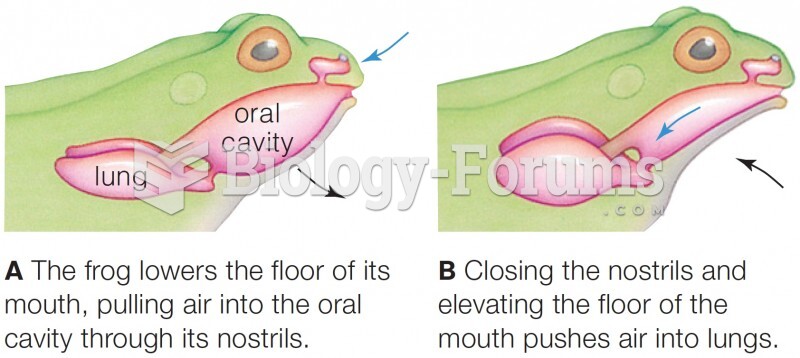 How a frog fills its lungs.