A company that fills soft drinks into bottles has established an -chart and an R-chart to monitor the average fill level in the bottles. To do this, the company has taken a series of samples of size n = 4 bottles. The overall average fill is 12.
03 ounces. The average range for the subgroups has been .06 ounces. Suppose, after developing the control chart, a subgroup of size 4 yields a sample mean of 12.09 ounces and a range of .08, which of the following statements is true?A) The process is in control on both the -chart and the R-chart.
B) The process is out of control on the R-chart but in control on the -chart.
C) The process is out of control on the -chart but in control on the R-chart.
D) The process is out of control on both the -chart and the R-chart.
Question 2
An industry study was recently conducted in which the sample correlation between units sold and marketing expenses was 0.57. The sample size for the study included 15 companies.
Based on the sample results, test to determine whether there is a significant positive correlation between these two variables. Use an alpha = 0.05A) Because t = 2.50 > 1.7709, do not reject the null hypothesis. There is not sufficient evidence to conclude there is a positive linear relationship between sales units and marketing expense for companies in this industry.
B) Because t = 2.50 > 1.7709, reject the null hypothesis. There is sufficient evidence to conclude there is a positive linear relationship between sales units and marketing expense for companies in this industry.
C) Because t = 3.13 > 1.7709, do not reject the null hypothesis. There is not sufficient evidence to conclude there is a positive linear relationship between sales units and marketing expense for companies in this industry.
D) Because t = 3.13 > 1.7709, reject the null hypothesis. There is sufficient evidence to conclude there is a positive linear relationship between sales units and marketing expense for companies in this industry.

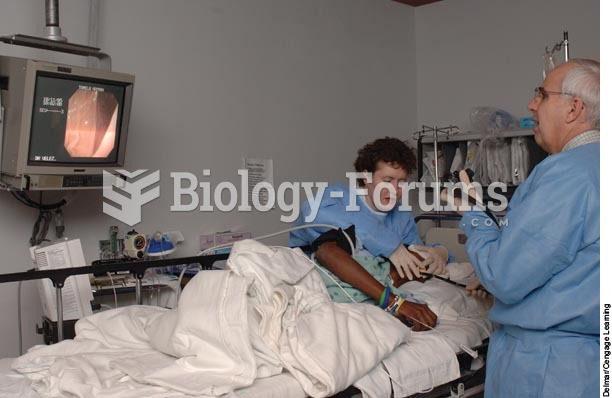 A client is having an endoscopy performed by a physician who views the upper gastrointestinal intern
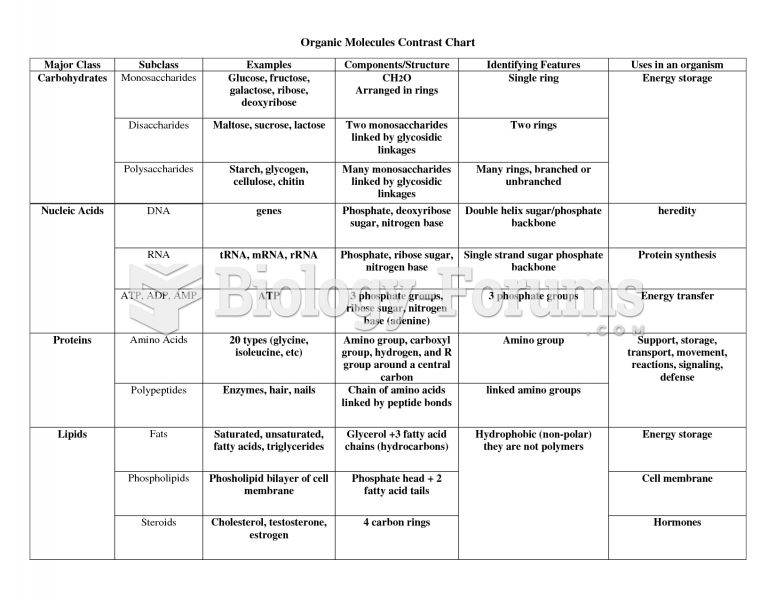 Ochem molecule contrast chart
 Shipwreck bottles
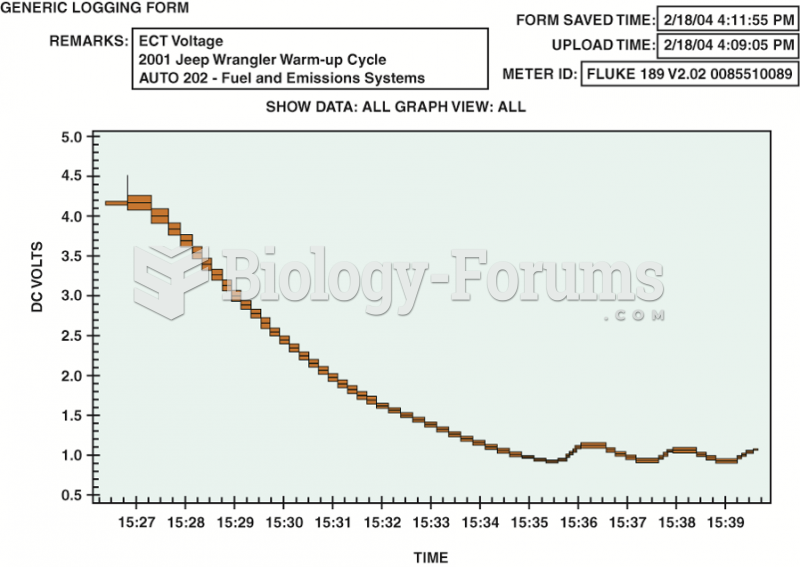 An ECT sensor being tested using a digital meter set to DC volts. A chart showing the voltage ...
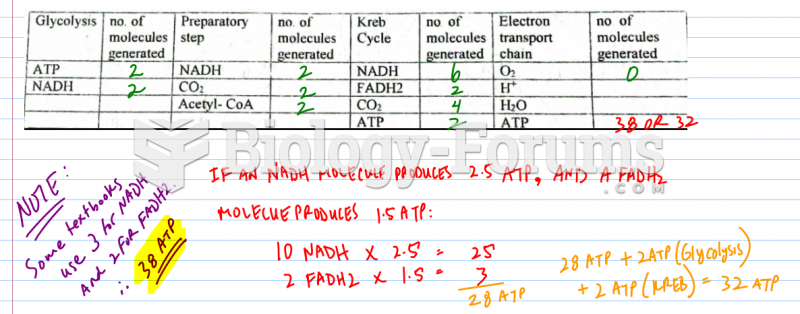 Cellular Respiration Chart (ATP)
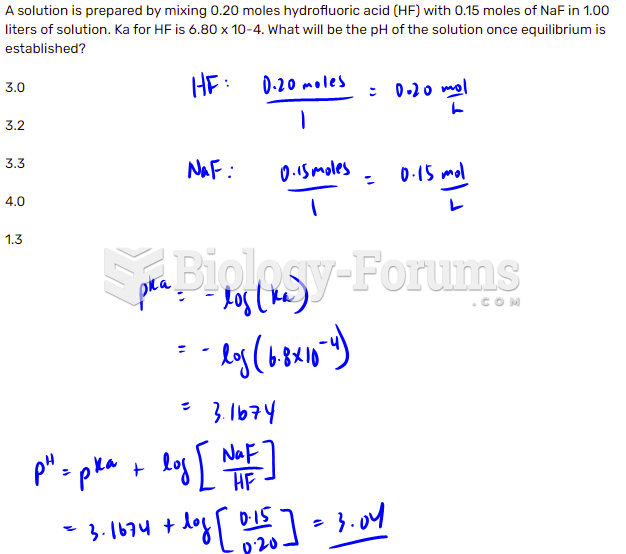 What will be the pH of the solution once equilibrium is established?