A histogram is an effective tool for graphically describing a joint frequency distribution.
Indicate whether the statement is true or false
Question 2
The following samples are observations taken from the same elements at two different times:
Unit Sample 1 Sample 2
1 15.1 4.8
2 12.3 5.7
3 14.9 6.2
4 17.5 9.4
5 18.1 2.3
6 18.4 4.7
Assume that the populations are normally distributed and construct a 90 confidence interval for the difference in the means of the distribution at the times in which the samples were taken.
A) (7.6232, 13.4434)
B) (5.2825, 15.8127)
C) (6.8212, 14.7821)
D) (7.4122, 14.6801)

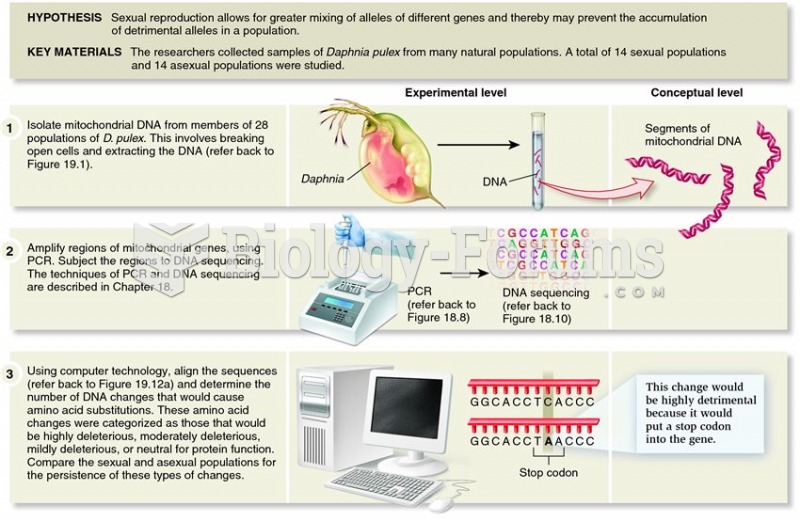 Paland and Lynch demonstrated the importance of sexual reproduction in reducing the frequency of mal
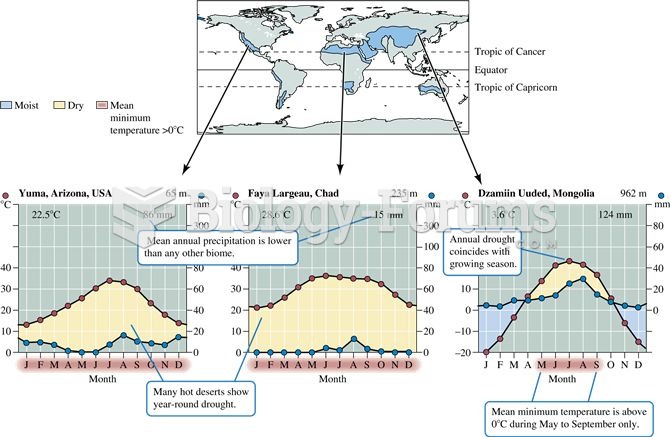 Desert distribution and climate
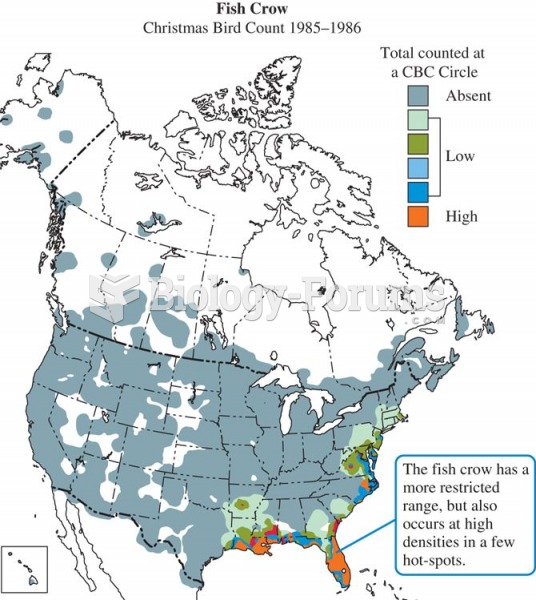 Winter distribution of the American crow, Corvus brachyrynchos.
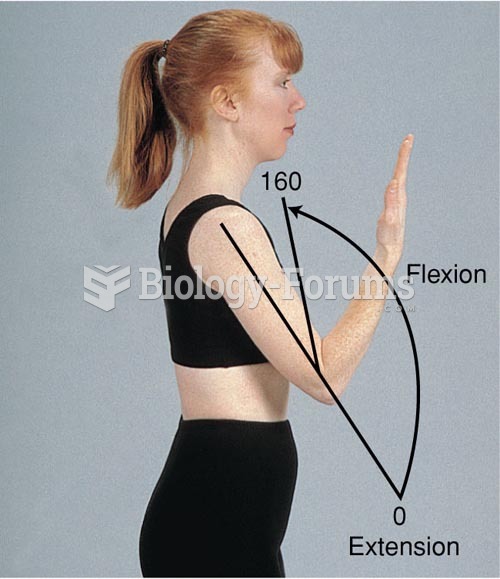 Range of Motion of the Elbow Joint, Flexion, Extension
 X-ray showing typical joint changes associated with osteoarthritis.
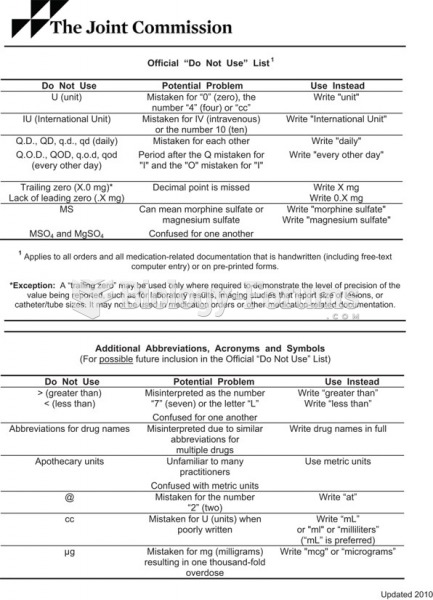 The official “Do Not Use” list as issued by The Joint Commission.