|
|
|

 Energy Chart
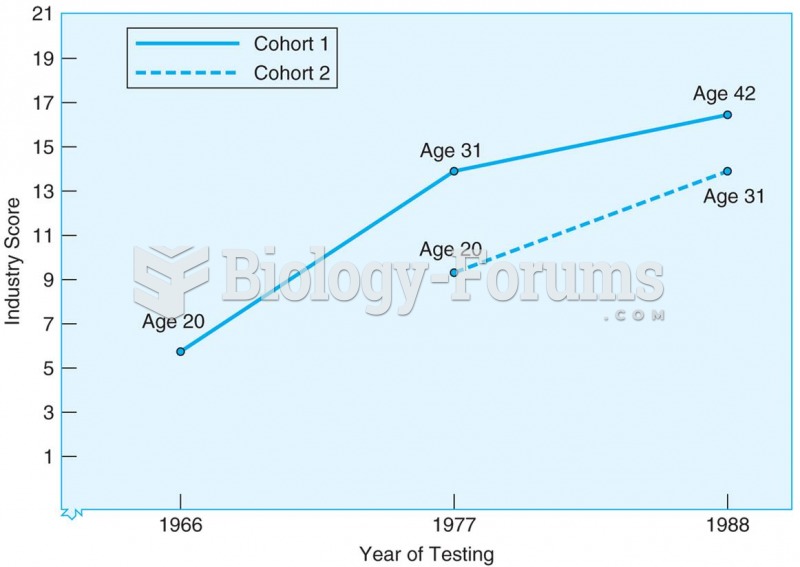 Results from sequential study of two cohorts tested at three ages and at three different points in t
 Carrie Mae Weems, Untitled (Man Smoking/Malcolm X), from The Kitchen Table Series.
 How to determine if a table of values represents a function
 Vegetable oils are good sources of essential fatty acids
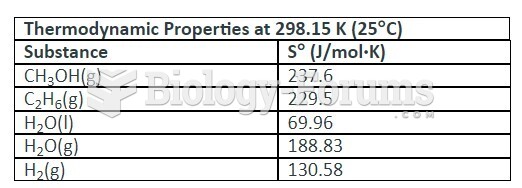 table
table