|
|
|

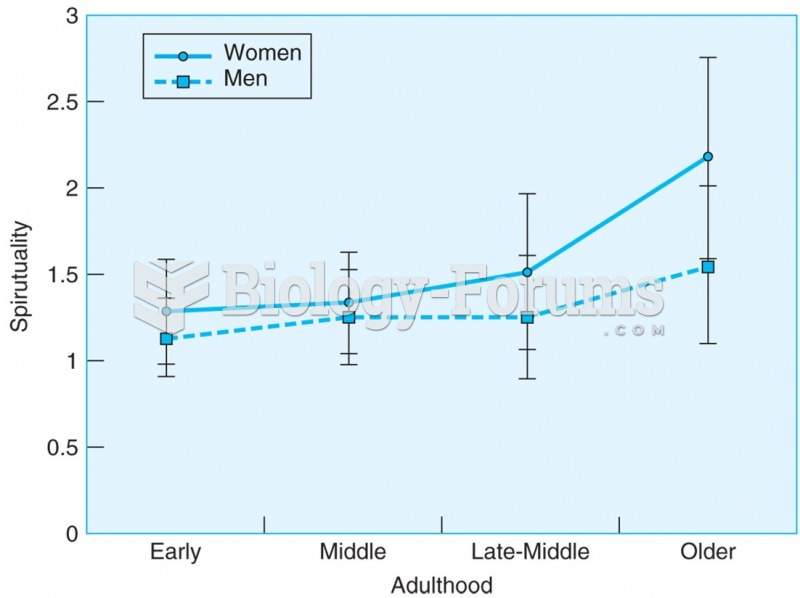 Spirituality increases with age, but there are different patterns for the two genders. Both genders ...
 The Method for Determining the Two-Point Discrimination Threshold
 The Importance in the World Fossil Fuel Economy
 EYEMA-O-BYERI (Reliquary Figure)
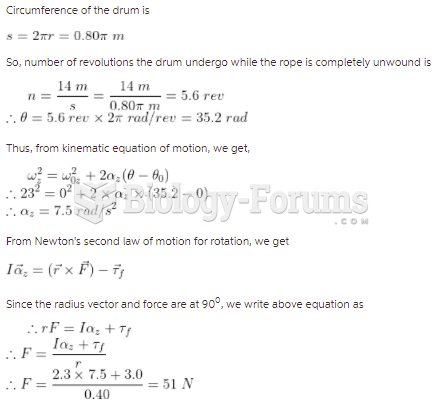 The drum shown in the figure has a radius of 0.40 m and a moment of inertia of 2.3 kg m2about ...
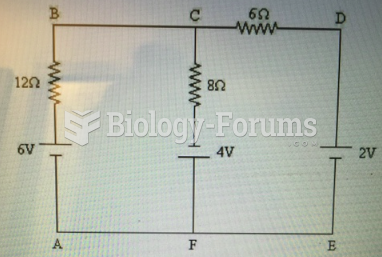 Identify the junction nodes in the circuit shown in Figure 21-1.