|
|
|

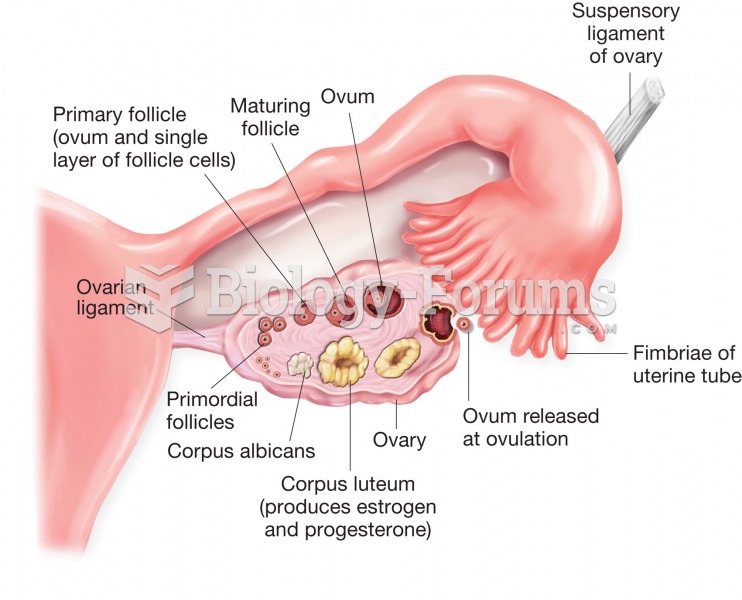 Structure of the ovary and uterine (fallopian) tube. Figure illustrates stages of ovum development a
 Exercise increases the heart rate.
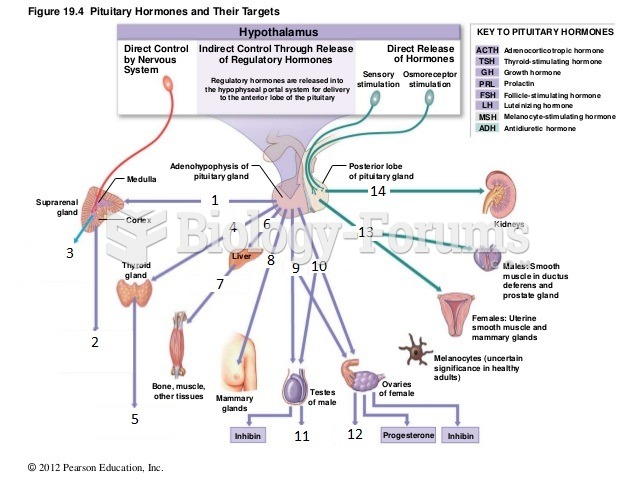 figure 18-1 pituitary hormones
 Figure and Ground
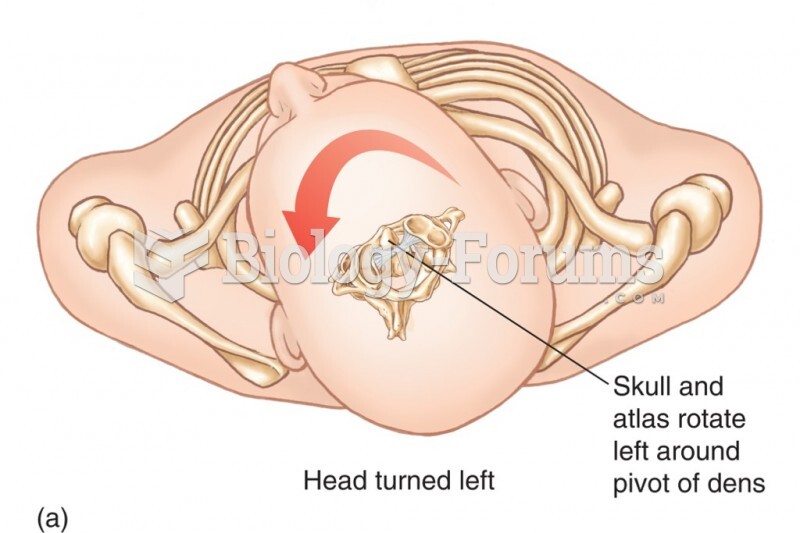 Relationship Between the Atlas and the Axis. The Dens of the Axis Provides a Pivotal Point Around Wh
 Constructing a Three-Point Recombination Map