|
|
|

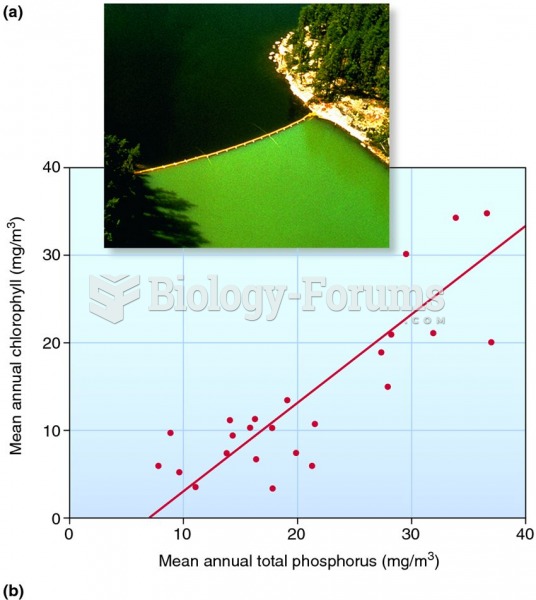 Primary production increases with an increase in total phosphorus concentration.
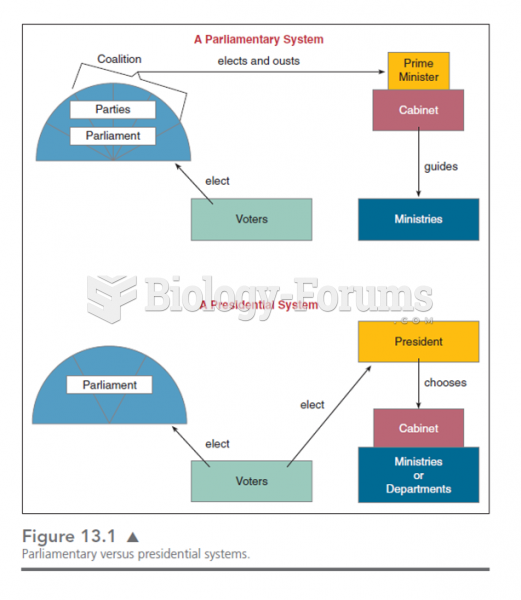 This chart shows the various lines of responsibility and how they differ in presidential and parliam
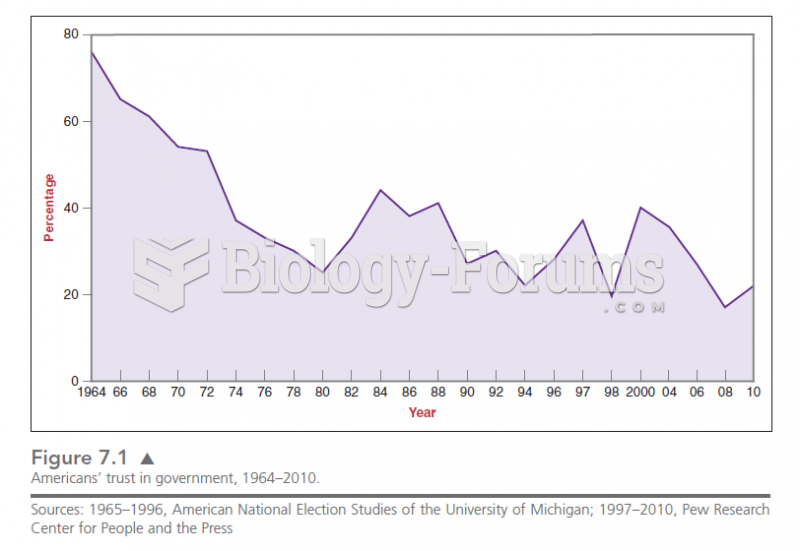 Figure 7.1 shows the rapid decline in the trust of Americans in government since the 1960s. This de
 The answer to “What is the proper role of children in an economy?” varies by social class, ...
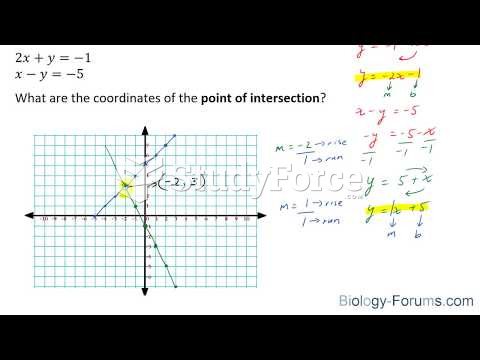 How to find the point of intersection of two straight lines by graphing
 Government By the People, 2016 Presidential Election, 26th Edition