|
|
|

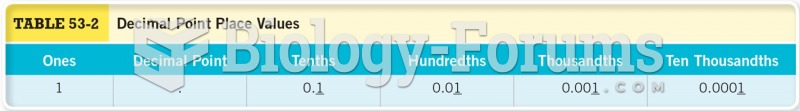 Decimal Point Place Values
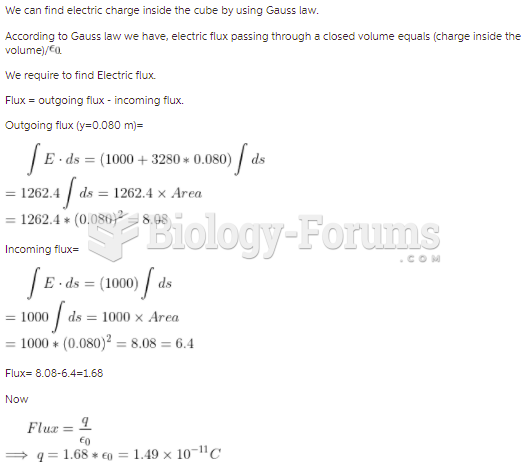 The cube of insulating material shown in the figure has one corner at the origin. Each side of ...
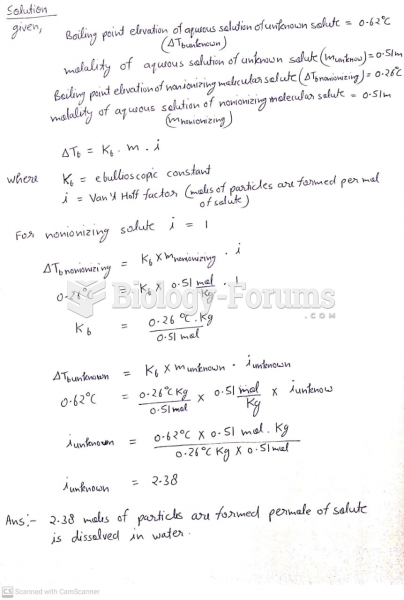 A 0.51 m aqueous solution of an unknown solute has a boiling point elevation of 0.62°C. The ...
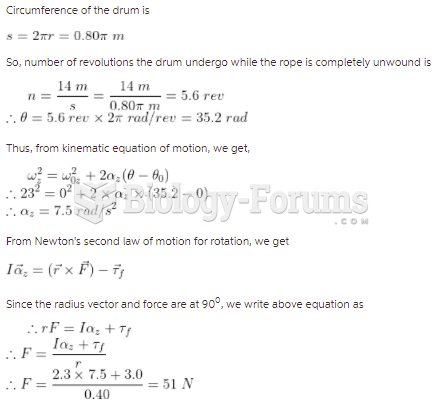 The drum shown in the figure has a radius of 0.40 m and a moment of inertia of 2.3 kg m2about ...
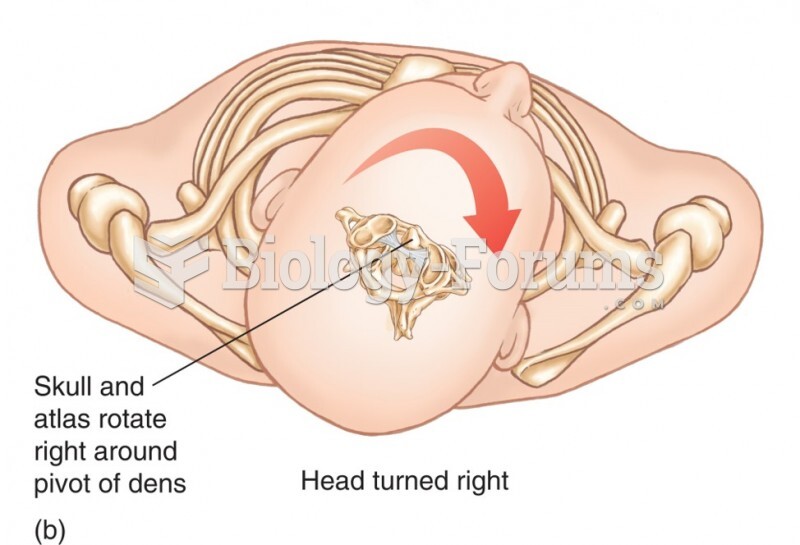 Relationship Between the Atlas and the Axis. The Dens of the Axis Provides a Pivotal Point Around Wh
 Point Mutations