|
|
|

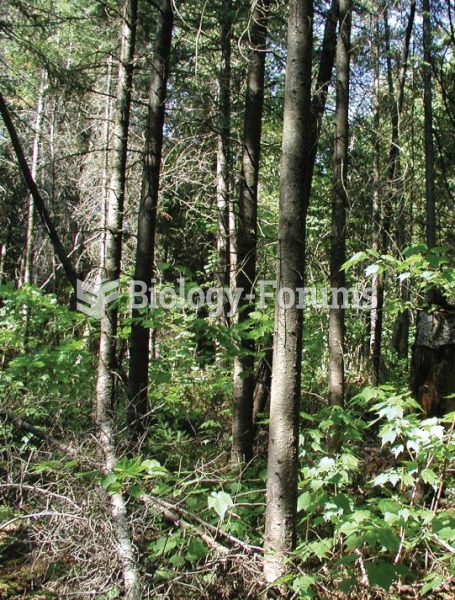 Changes in boreal forest composition along a chronosequence in Quebec. Dates refer to the year of th
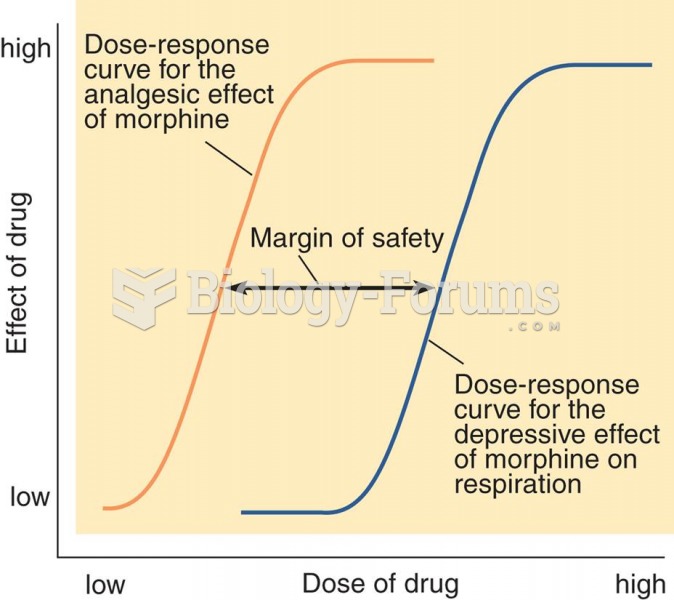 Dose-Response Curves for Morphine
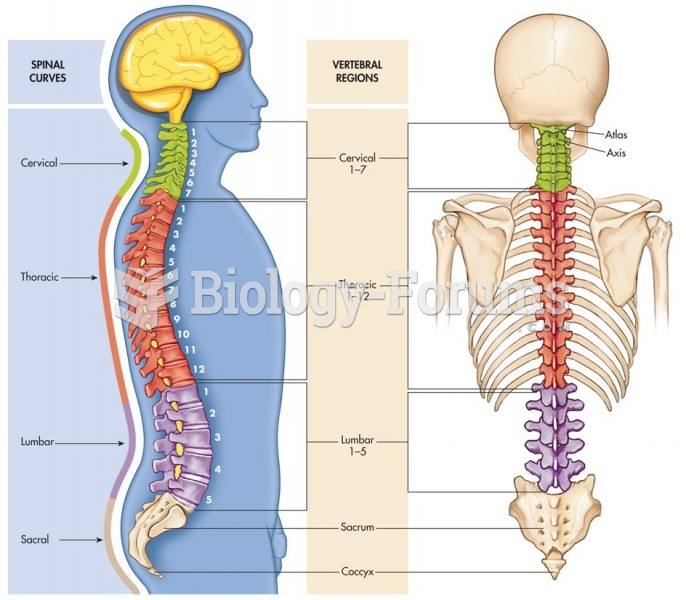 Vertebral regions showing the four spinal curves.
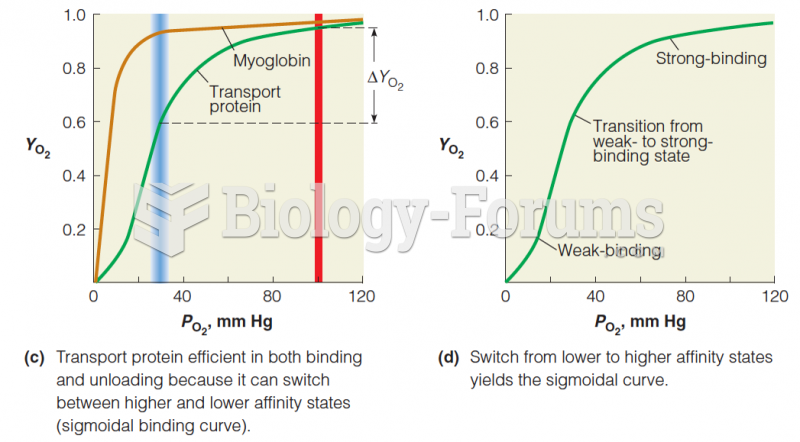 Cooperative vs. noncooperative O2-binding curves
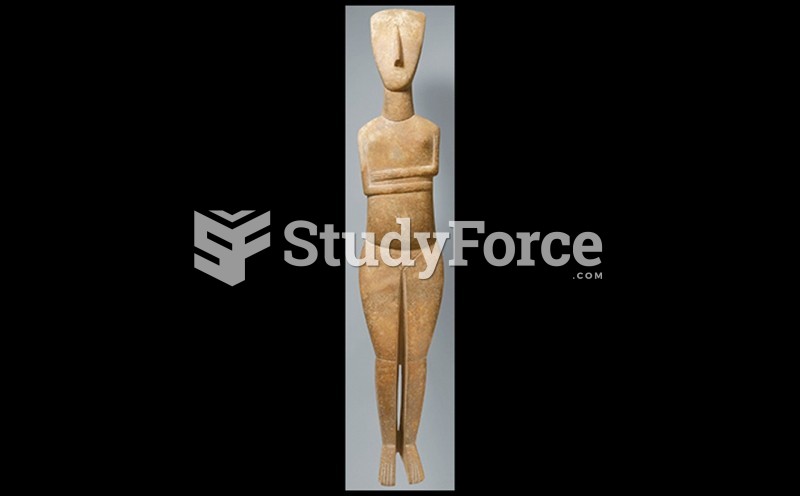 Figure of a Woman with a Drawing Showing Evidence of Original Painting and Outlining Design Scheme
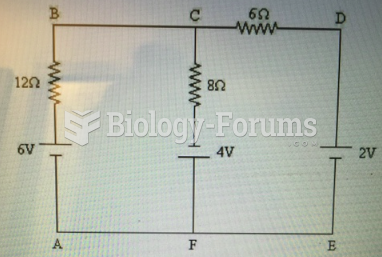 Identify the junction nodes in the circuit shown in Figure 21-1.