|
|
|

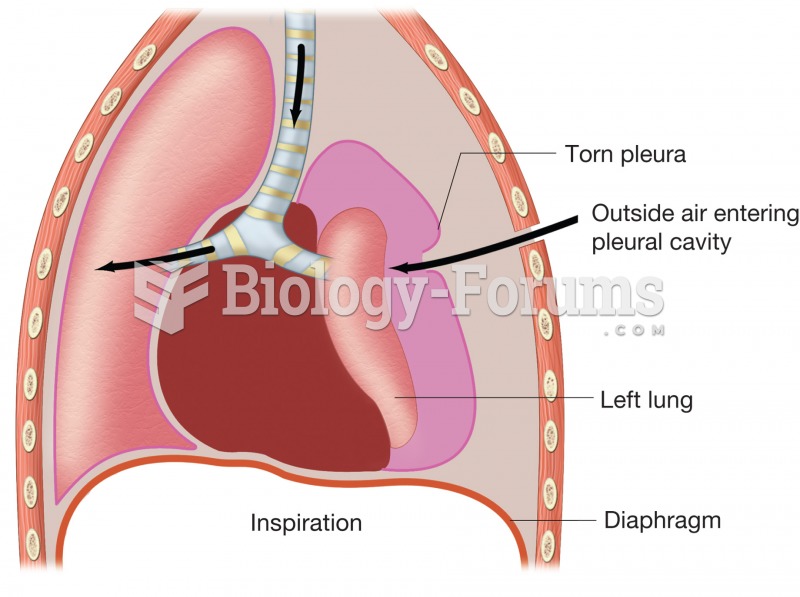 Pneumothorax. Figure illustrates how puncture of thoracic wall and tearing of pleural membrane allow
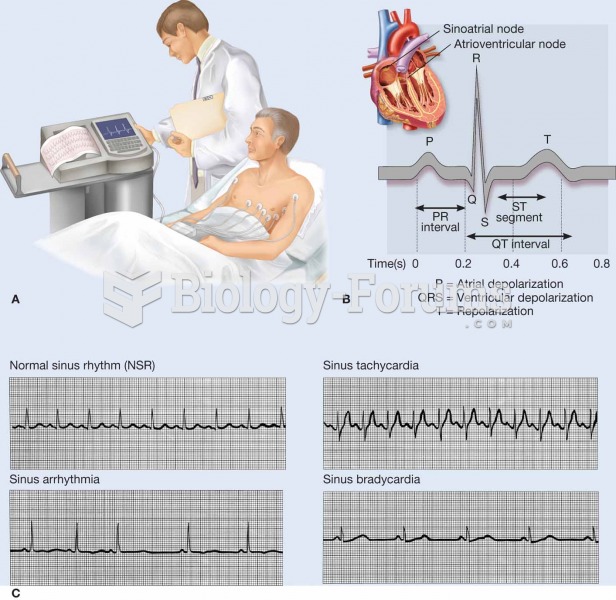 An electrocardiogram (ECG, EKG) is a commonly used procedure in which the electrical events associat
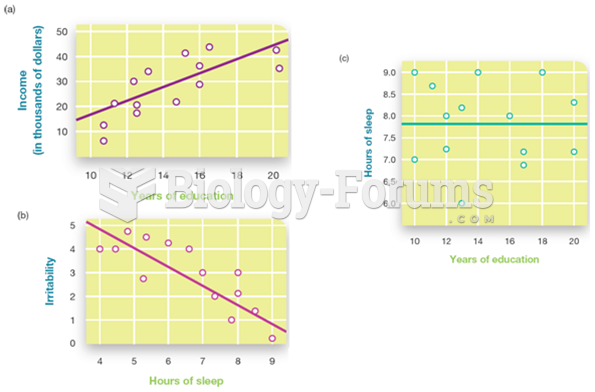 Correlations are Depicted in Scatterplots
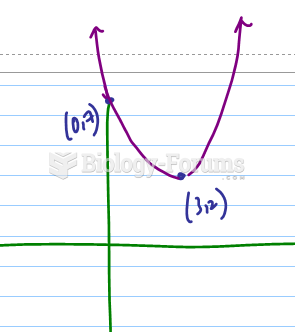 If a graph has the following x-intercepts, which value of x is the instantaneous rate of change ...
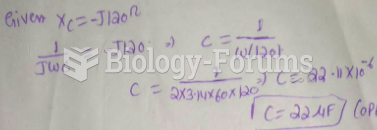 If the frequency equals 60 Hz in Figure 10-1, what is the value of capacitance?
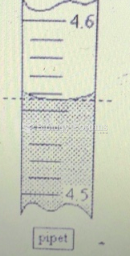 If you were recording the volume of liquid in the pipet depicted, what volume wo